ObamaCare Deficit and Debt


ObamaCare decreases the deficit and debt with cost controlling provisions and taxes, but subsidies, protections, and healthcare spending may result in more debt over the long term if no further changes are made.
UPDATE 2019: This page was created in 2015, numbers have been revised since this was written. So the logic remains the same, but the specific numbers need to be updated. You can get a solid sense of how things are below, but because of changes under the Trump administration and changes in general it is important to keep up to date on the latest CBO reports. Here is a 2019 report from the CBO. Check the CBO website for recent facts and figures.
- As of March 2015 the estimated net cost of ObamaCare’s insurance related provisions is $1.207 trillion (the gross cost of ObamaCare is $1,707 offset by $500 billion in revenue for 2015–2025). That’s down from previous projections and is in part due to less people getting subsidies. Learn about other reasons here.
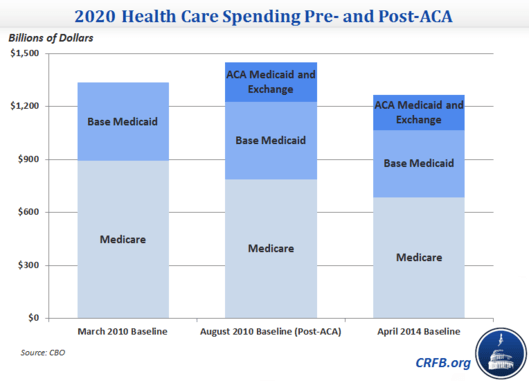
- One should consider that ObamaCare reduced wasteful spending on Medicare by over $700 billion and including cost curbing measures, so the gross cost of healthcare spending (on Medicaid, Medicare, and ACA) didn’t rise much under the ACA (see the graphic below that shows spending before and after the ACA).
- According to one CBO report the estimated cost of repealing the ACA (and doing nothing else) is $353 billion without microeconomic feedback and $137 billion with microeconomic feedback over the next 10 years.
- The key to understanding the real impact of the ACA is understanding that the bulk of the law actually curbs healthcare spending, cuts wasteful spending, and takes in revenue, while only a smart part contributes to spending. Over the next decade spending has a major impact, but the cost curbing measures becomes exponentially more important over the long term to prevent unsustainable growth in healthcare costs.
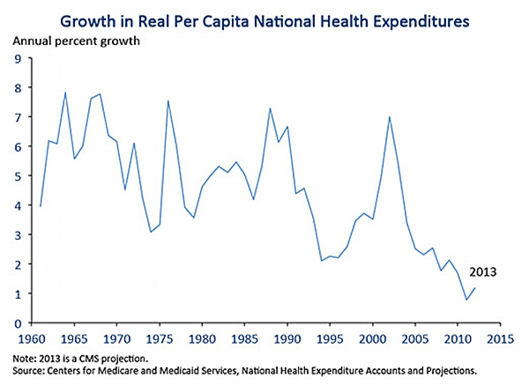
- Under the ACA health care spending grew at the slowest rate on record (since 1960). Meanwhile, health care price inflation is at its lowest rate in 50 years.
- In 2015 our country will spend over 3 trillion on healthcare, that amount rises every year. In 2022 we are projected to spend 5 trillion.
TIP: The impact of repeal really depends on what the ACA is replaced with, if anything. Consider, the CBO and JCT estimate that enacting the Better Care Reconciliation Act of 2017 (the ObamaCare repeal and replace reconciliation bill) would actually reduce federal deficits by $321 billion over the coming decade… but at the cost of increasing the number of people who are uninsured by 22 million in 2026 relative to current law (for a total of 49 million uninsured). How does it repeal the ACA without losing that $137 billion? The answer is it leaves in place many of the ACA’s provisions and trades assistance spending for tax cuts (cutting more assistance than taxes; thus resulting in a surplus at the expense of 22 million uninsured). The cost of 22 million more uninsured aside, to get this $321 billon surplus over a ten year period: $772 billion is cut in Medicaid spending and $408 billion is cut in assistance, meanwhile this spending cut over a ten year period is offset by decreased revenue over ten years which comes from $541 billion in tax breaks, $107 billion in spending to reduce premiums to insurers, and $210 billion less in mandate penalty payments.
Keeping down the growth in healthcare spending is 50% of the mission, the other 50% is making sure revenue and cost curbing can balance out new spending under the ACA.
Summary of ObamaCare Deficit and Debt
ObamaCare (Affordable Care Act) related taxes and cost curbing measures help to bring the deficit down. However, over time as more people get subsidies and health care costs rise, total healthcare spending outpaces revenue from cost controlling provisions and taxes.
Keeping America covered through Medicare and expanding access under Medicaid and the ACA costs money. Lots of money. But the ACA has done a lot to counter balance not just it’s own spending, but healthcare spending in general.
Assuming all other spending and revenue remains the same (ie. no war, no bailouts, no banking crisis) here is what we are looking at:
- We currently have a deficit, we have since 2002 (ie the events of 2001). Each year that we have a deficit we have to borrow money. Borrowing money creates more debt. We then owe interest on that debt. That creates a bigger deficit. And so on and so forth. We compare publicly held debt to Gross Domestic Product (GDP) to get an idea of the economic health of our country.
- The reason we needed healthcare reform in the first place (aside from the 50 million without coverage) was the rising cost of healthcare. AKA the “health care crisis“.
- If no other measures are taken: ACA and non-ACA healthcare spending are projected to rise at an unsustainable rate, contributing to an increasing deficit, and thus increasing publicly held debt over the long-term.
- The two other major factors in spending are Social Security and Military Spending.
- By raising the Social Security age to 67, Social Security is now projected to be sustainable.
- Military spending on the other hand… and now for something completely different…
- Despite long term projections, in the short-term the ACA has actually helped to drastically reduce the deficit and curb healthcare spending.
- Looking further down on the page you’ll see that the Obama administration’s policies have helped to decrease the deficit drastically, helping to bring down the deficit from the Bush administration.
- A sizable portion of this decrease in deficit can be directly contributed to the ACA.
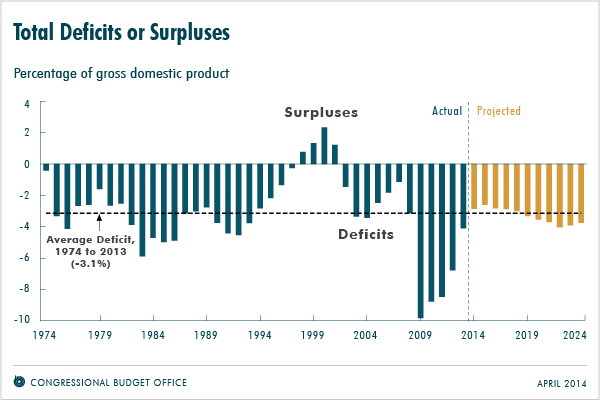
- The current deficit is actually pretty normal when compared to the history of the deficit. However, the deficit compared to GDP just barely dips below 40 year average levels, before being projected (by the CBO) to curb back up again due to the rising cost of healthcare and healthcare subsidy spending.
- Medicare, Medicaid, and ACA spending all contribute to the deficit, the root of that spending is the growing cost of healthcare.
- Most of the 1000 pages of the ACA helps to reduce healthcare spending and combat the growing cost of healthcare.
- Many of the positive effects of cost curbing measures are just starting to show. Last year, health care spending grew at the slowest rate on record (since 1960). Meanwhile, health care price inflation is at its lowest rate in 50 years.
- We won’t know the full effects of cost curbing measures for some time, projected deficit and debt under ObamaCare could grow slower if the provisions are more effective then expected.
- Subsidies are one of the main causes of healthcare spending (in part because they directly relate to health care costs), but most of the rest of the law actually helps to bring costs down and revenue in to balance this.
- Since subsidies spending and healthcare costs in general are the two major factor in healthcare’s contribution to the deficit, additional measures may have to be taken. This could result additional cost curbing measures, refinements to the current law, increased taxes, decreased subsidies, further regulations, or a mix.
- The end goal should be to have a near 100% uninsured rate (realistically 90-95%) and to bring down healthcare spending. A perfect solution wouldn’t simply repeal subsidies, and certainly wouldn’t repeal cost curbing measures.
- It’s important to note that the health of Americans is not accounted for in regards to GDP. Thus we could compare a happy healthy society, with a healthcare spending problem, to a society with 50 million who lacked coverage, with slightly less growth in healthcare spending. On paper the one with less spending would look better, in reality the one with a healthy population may be a better place to live.
Know Which ObamaCare CBO Report to Look At
The key to understanding the above is rooted in understanding two important ongoing reports by the Congressional Budget Office (CBO) and Joint Committee on Taxation (JCT). By paring these with a little economic history 101, the whole thing starts to click.
The CBO produces two different reports that related to the ACA.
- One report for ACA coverage provisions. Updated Jan 2015 Estimates of the Insurance Coverage Provisions of the ACA
- One report for the net impact of the ACA on the budget. CBO’s Jan 2015 Baseline Projections
There are two reports due the discrepancy between spending on ACA coverage provisions and the revenue from related taxes, versus long term cost curbing measures contained within the law. It also helps us to differentiate between Medicare, Medicaid, and ACA subsidy spending.
By comparing these reports you’ll see that despite the $1.35 trillion dollar price-tag, the ACA’s cost curbing measures actually help reduce the deficit in the short term. Yet, healthcare spending (along with other spending) increases the deficit over the next decade.
Gross Costs of ObamaCare
CBO report April 2014: The gross cost of ObamaCare is $1,839 offset by $456 billion in revenue for 2015–2024, for an estimated net cost of 1.36 Trillion. It is the Congressional Budget Office’s job to point out what must change with spending to keep the deficit and debt in-line. Sot it is expected that we see cost curbing measures and taxes on the table for 2015.
CBO report January 2015: The gross cost of ObamaCare is $1,993 offset by $643 in revenue for 2015–2024, for an estimated net cost of 1.35 Trillion. Note that this is due primarily to less people than projected getting subsidies during open enrollment 2015. CBO predicted 13 million in April, but revised that to 12 million in January. It’s important to understand they mean average enrolled throughout 2015, not those who enroll during open enrollment only (HHS predicts 9.1 million enrolled by February 15th, 2015). You’ll note that an additional $200 billion in revenue is also projected.
See the latest CBO report from July 2015 here. This report looks at the cost of repeal. Generally projects are on par with the January 2015 report.
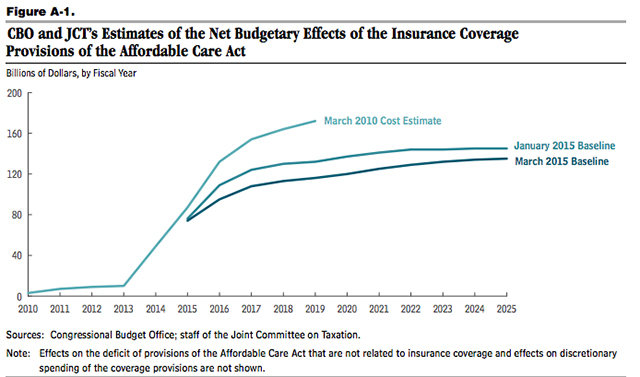
CBO report March 2015: In 2015 – 2025 updated budget projections the CBO estimate the gross cost of ObamaCare to be $1,707 offset by $500 in revenue for 2015–2024, for an estimated net cost of 1.207 Trillion. This is, in-part, due to a downward trend in spending by private health insurers on health care and administration. The CBO and JCT estimate that growth in private health insurance spending per enrollee over the 2006–2013 period averaged 1.8% per year, compared with an average rate of 5.0% per year during the 1998–2005 period.
FACT: We are still going to face debt outpacing GDP if we don’t fix our spending issue. In a nutshell the January report doesn’t look much different than the April one used to cite numbers on this page.
Net Costs of ObamaCare
Currently for 2015 net costs of the ACA are $76 billion and $1.35 trillion from 2015-2025.
CBO and JCT estimate that the net costs of the coverage provisions of the ACA will rise sharply as the effects of the act phase in from 2015 through 2017, continue to rise steadily through 2022, and then change little from 2022 through 2025. The annual net costs are estimated to level off at about $145 billion in the last years of the projection period.
Cost Curbing Facts
According to a recent HHS report, the ACA does seem to be making good on it’s promise to curb costs. While it may not take into account pervading problems, the below facts are all very good for healthcare spending and the economy in general. See the full fact list from the February 2015 HHS report here.
- Taxpayers are benefitting as costs and spending are held down. Last year, health care spending grew at the slowest rate on record (since 1960). Meanwhile, health care price inflation is at its lowest rate in 50 years.
- Record-breaking recovery of $19.2 billion from health care fraudsters. Over the last five years, the administration’s enforcement efforts, combined with new tools provided by the Affordable Care Act, have recovered $19.2 billion in taxpayer funds, up dramatically from $9.4 billion over the previous five-year period.
- And as we build a better, smarter, healthier delivery system, we have seen a historic slowdown in the growth of health care costs that is generating savings for workers, business, and taxpayers. Slow growth in the cost of health care has continued, with health care price inflation remaining at low levels not seen in decades, employer premium growth tying record lows, and Medicare spending per beneficiary essentially unchanged in fiscal year 2014.
A Summary of ObamaCare, the Deficit, and Debt
In simple terms this page says. Deficit is bad, debt is worse. Bush caused a big deficit, Obama dealt with it. The ACA causes a slight uptick from 2015-2025 due to subsidies, despite cost controlling measures that helped from 2010-2014 (and continue to help moving forward. At the end of the day healthcare spending in general is the real issue. More legislation (either reduced spending, increased taxes, or more cost control) is needed to control publicly held debt.
Getting Educated on ObamaCare, the Budget, the Deficit, and Debt
Our ACA cost estimates are directly from the official CBO report on ObamaCare’s costs updated April 2014.
To properly understand the budgetary effects of the law, we suggest a full reading of recent Congressional Budget Office (CBO) reports on the ACA. You can find a summary of the latest CBO cost estimates for the Affordable Care Act here.
To understand the impact of our current laws on the Federal Deficit and Debt please see the August 27 report from the Congressional Budget Office: An Update to the Budget and Economic Outlook: 2014 to 2024.
Other resources used on this page include UsGovernmentSpending.com and GAO.Gov.
It’s not Just ObamaCare, it’s HealthCare Spending
It’s not just the Affordable Care Act impacting the deficit and debt, but the rising cost of healthcare itself which includes Medicare, Medicaid, and the Affordable Care Act and is a result of the entire $3 trillion dollar health care industry. In fact half the reason the ACA was passed was because this upward trend was happening independent of the law. Given this, and the complexity of other spending that effects the deficit an debt, the impact of the ACA on the deficit and debt is only a fraction of the overall picture.
Let’s take a look at how the Affordable Care Act curbs rising health care costs, how it adds to spending on healthcare in other areas, and why it matters.
FACT: To put it in perspective Healthcare (mostly Medicare and Medicaid), Social Security, and Military spending account for roughly 70% of total spending by the Federal Government. As you can see from the graph below Social Security isn’t the issue, it’s healthcare spending and interest on debt that are the “crisis”.
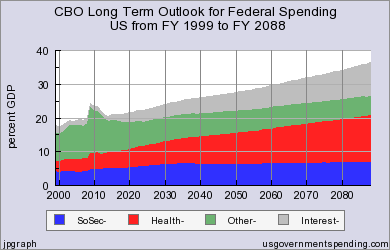
UsGovernmentSpending.com shows how rising healthcare costs contribute to interest rates that result in more publicly held debt and an increased deficit. Keep in mind projections are based on what will happen if nothing changes, not what will happen no matter what.
What is the Federal Deficit?
The deficit is the amount that total spending under the current budget exceeds income for a year. When the deficit his high, we borrow money (debt).
The Federal Deficit is the amount by which the government’s total budget outlays exceeds its total receipts for a fiscal year. —US Senate
What is Gross Domestic Product (GDP)
Gross Domestic Product (GDP) is the total value of goods produced and services provided in a country during one year. We compare the deficit to GDP to get an idea of how our deficit relates to how well the economy is doing. We do the same with debt. The average deficit over the past 40 years has been about 4 percent of GDP. Keep in mind calculating GDP is a little wonky, you can learn more about it WikiHow.
GDP is important, but isn’t directly related to budgetary effects on the deficit or debt.
NOTE: It should be noted that GDP is measured by spending. So a bunch of happy healthy Americans sitting on piles of money, but not spending, would substantially reduce GDP and thus show a high GDP to debt ratio… despite Americans actually “doing well”. When we look at the effects of the ACA and health care spending, we should take into account the value of Americans having access to health care.
What is Federal Debt?
Debt, or Federal Debt, is the total amount of money that the United States federal government owes to creditors. The government’s creditors include all individuals, businesses, governments and other organizations that own U.S. government debt securities.
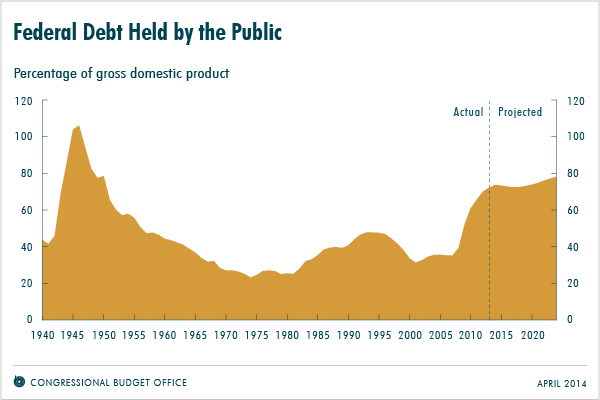
Debt is accrued by borrowing money based on the deficit. The debt is held by the public as Federal Debt, and our country has to pay interest on that debt. A little debt is good, debt at projected levels seen below is really bad. Also look below at the chart to see which Presidents were in office in the years leading up to debt spikes, notably:
Franklin Delano Roosevelt 1933 – 1945
Ronald Reagan 1981 – 1989
George Walker Bush 2001– 2009
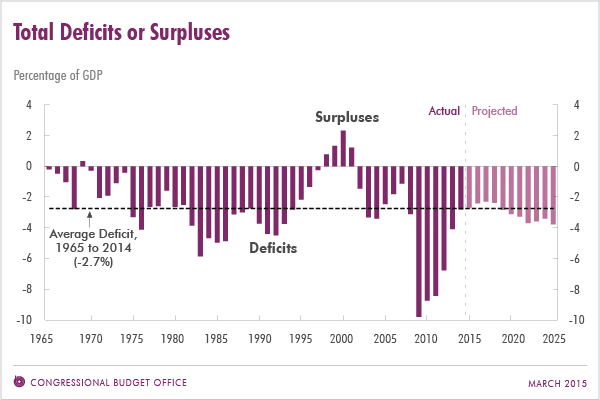
NOTE: Under President Obama debt rose sharply due to actions of the Bush administration, the ACA’s contributions to debt are best seen by looking at the 2015-2025 period. The little downturn before that shows the cost controlling measures taking effect before subsidies cause the rise again.
According to the CBO large and increasing amount of federal debt would have serious negative consequences, including the following:
- Increasing federal spending for interest payments,
- Restraining economic growth in the long term,
- Giving policymakers less flexibility to respond to unexpected challenges, and
- Eventually increasing the risk of a fiscal crisis (in which investors would demand high interest rates to buy the government’s debt).
Interest Rising Overtime
The problem with owing too much interest is that we are spending all of our money paying back interest instead of investing in our economic growth and standard of living. The more debt, the more interest, the more the problem snowballs. Meaning that we are in deep-hot-water if we actualize the scenarios in any of the graphs above. Note that we held more debt during WWII.
How Deficit and Debt Works Together
Deficits in the short term may not be a problem but continuing deficits over the longer term are a concern.
When the budget is in deficit, the government borrows from the public and increases the level of debt held by the public. The federal government—like other borrowers—pays interest on its debt. Interest spending can absorb resources that could be used for other national priorities. It can also limit the government’s flexibility to address emerging budget issues, unforeseen challenges—such as another economic downturn or a large-scale natural disaster—or other fiscal exposures that may require future spending.
Also, deficits matter in the long run because they consume savings that otherwise could be productively invested. Therefore, they could reduce economic growth and the standard of living.
Of course the improvements the ACA makes to the healthcare system, improve the standard of living in their own right.
The Deficit Leading up to 2009
As you can see from the chart at the top of the page and table below something really fishy happens in 2009. The deficit reaches a peak of 9.8 percent GDP (compare to the high of 4 percent in 2024 under the ACA). Here is the explanation for that:
In 2015 the projected Federal Deficit is $563.57. As a result of the Bush presidency it got as high as $1,413 in 2009.
TARP=Bush, ACA=Obama
The deficit of a Presidents first year, being the result of the last President. The smoking gun here is Troubled Asset Relief Program, or TARP. Whether that was needed as a result of Bush’s actions as President is another page). Although the actual deficit that year was high, only about $800 billion was long term TARP loans. You can see the complex effects of this play out through fiscal years 2009-2013 below.
FY 2005: $318 bln
FY 2010: $1,294 bln
| Year | GDP-US $ billion nominal |
Population-US million |
Federal Deficit -fed $ billion nominal |
|
| 2009 | 14417.9 | 306.772 | 1412.69 | a |
| 2010 | 14958.3 | 309.347 | 1294.37 | a |
| 2011 | 15533.8 | 311.722 | 1299.59 | a |
| 2012 | 16244.6 | 314.112 | 1086.97 | a |
| 2013 | 16797.5 | 316.498 | 679.50 | a |
| 2014 | 17332.3 | 318.857 | 483.35 | a |
| 2015 | 18219.4 | 321.369 | 563.57 | b |
| 2016 | 19180.6 | 323.996 | 531.13 | b |
| 2017 | 20199.4 | 326.626 | 457.83 | b |
| 2018 | 21216.3 | 329.256 | 413.28 | b |
| 2019 | 22196.1 | 331.884 | 502.67 | b |
| Legend: a – actual reported b – budgeted estimate in US FY16 budgetData Sources for 2009: GDP, GO: GDP, GO Sources Federal: Fed. Budget: Hist. Tables 3.2, 5.1, 7.1 State and Local: State and Local Gov. FinancesData Sources for 2019: GDP, GO: GDP, GO Sources Federal: Fed. Budget: Hist. Tables 3.2, 5.1, 7.1 State and Local: State and Local Gov. Finances ‘Guesstimated’ by projecting the latest change in reported spending forward to future years |
||||
How ObamaCare Affects the Deficit and Debt
The ACA includes many cost curbing measures to slow the growing cost of healthcare. If there were not any spending involved with the ACA it would have a significant affect on the deficit and potentially even creating a surplus over time.
Obamacare is projected to cut the national deficit by over $200 billion during its first 10 years, and over $1 trillion over the next two decades. This helps offset the estimated $1.36 trillion net cost of ObamaCare’s insurance related provisions (the gross cost of ObamaCare is $1,839 offset by $456 billion in revenue for 2015–2024).
Despite what the ACA does to curb costs, and the large reduction in the deficit under the ObamaCare administration (illustrated in the CBO updated budget projections 2014-2024), the deficit is projected to rise above average levels from 2015 to 2024. Also federal debt held by the public is projected to rise as well. Even current debt held by the public is at an alarming high currently.
The Current Predictions are Not Set in Stone
Please be aware the cost estimates are changed on a regular basis and CBO budget projections are specifically meant to point out to legislators where the economy is heading without change. New policies and updated spending projections can change things drastically. New cost controlling measures and balances to the budget are being rolled out every year. A new CBO report should arrive in the spring which will let us see updated budgetary impacts of all types of spending.
Author: Thomas DeMichele
Thomas DeMichele is the head writer and founder of ObamaCareFacts.com, FactsOnMedicare.com, and other websites. He has been in the health insurance and healthcare information field since 2012. ObamaCareFacts.com is a...
Thomas DeMichele's Full Bio