ObamaCare: Uninsured Rates


Let’s Take a Look at the Uninsured and How the Affordable Care Act has Changed Things
The uninsured rates dropped to all times lows under the Affordable Care Act. The rate has however changed over time, for example, the rate rose under Trump (in part due to the fee for not having coverage being reduced to $0) and lowered under Biden, in part due to the expansion of assistance and enrollment options due to Covid relief.[1][2]
The Uninsured Rate as of 2022
The uninsured rate fell from 10.3% in 2020 to 8.9% in the third quarter of 2021 according to HHS data. Meanwhile, CMS has the rates at 9.8% and 9.5% for 2021 and 2022 respectively. Please note that the exact numbers depend on how polling is done and which demographics are looked at. However in general the uninsured rate is at or near recent lows and is lower than it was in past years before Biden and certainly than it was prior to the Affordable Care Act going into effect.
The recent drop in the uninsured rate is in large part to President Biden’s American Rescue Plan which expanded cost assistance and enrollment options.
Below we present older data to give a sense of how the uninsured rate has changed over time, and how different sources and methods for collecting data can impact the numbers.
The Uninsured Rate as of 2019
Specifically, according to Gallup data, the uninsured rate under the Affordable Care Act (ObamaCare) dropped to record lows of 10.9% in 2016 but has since risen to 13.7% in 2019. NOTE: This is looking at the 18 – 64 age demographic only (the demographic most likely to fluctuate).
That increase represents an increase of about seven million adults. Still, the Affordable Care Act, even with changes like the individual mandate fee being moved to zero in most states, has resulted in a net decrease to the uninsured rate (i.e. more people have coverage now than they did before the law; with the uninsured rate a “decrease” in the rate is good).
It is notable that the uninsured rates dropped more in states that embraced the law, for example by expanding Medicaid. However, despite opposition to Medicaid in some states, and despite changes to the law like the repeal of the mandate, uninsured rates have remained relatively low compared to the pre-ACA era when for example as many as 18.4% of 16 – 64 demographic was uninsured in 2010.
With that said, calculating the exact uninsured rate isn’t easy, and generally, we have to rely on polling and data from different sources (so specifics are subject to debate). Also, it is worth mentioning, when people say “uninsured rate” they can either be referring to the total uninsured rate for all ages or the 18 – 64 uninsured rate specifically.
With that in mind, let’s go over some data from the Census, which looks at all age demographics, to weigh against the Gallup data above.
According to a 2018 Census report on health coverage, for all ages and all insurance types: in 2018, 8.5% of people, or 27.5 million, did not have health insurance at any point during the year. That number increased from 2017’s 7.9%, or 25.6 million. This can be compared to 8.8%, or 28.1 million, for 2016; and to 91.%, or 29 million, for 2015 (see the 2016 report for that data).
The numbers above can be broken down by age group and quarter as well, for example, as of Q1 2016 (according to census data, see our breakdown of that data):
- Total Uninsured Rate: 8.6% (exceeded 10%)
- 18-64 Only: 11.9% (nearing 10%)
- 0-17 Only: 5.0%
- Over 65: Not typically counted in ACA-related studies, it’s near 100% according to this study (but not exactly 100%).
Now, keep in mind we don’t have 2019 census data, but we do have some data including that Gallup poll, and that tells us the 18-64 uninsured rate has risen a few percentage points.
So, for now we can see the uninsured rate hit lows and then started to rise a bit, and we can see that the gallup poll suggests the uninsured rate hit recent highs in 2019, but we are still waiting on confirmation from the Census report.
Still, the bottomline is this: The uninsured rate hit lows under the ACA, although the trend has gradually reversed under the Trump administration (likely at least in part due to changes to the law like the removal of the mandate).
MORE READING: KFF.org does a really great job presenting healthcare data. Their page on the uninsured rate under the ACA presents a lot of very useful data that augments the data from many sources we have collected for this page. Check out Key Facts about the Uninsured Population (updated Dec 2018). Other useful sources include the CDC, the Census Bureau, and NHIS.
The ACA and Uninsured Rates: States that embraced setting up their own marketplaces and expanding Medicaid made big headway in reducing numbers of uninsured, while states that rejected and fought the program have seen less success.FACT: According to a November 2015 Kaiser poll on the uninsured. Only 11% of uninsured polled knew open enrollment started on November 15th, 2014. Get the facts on open enrollment in the Health Insurance Marketplace.
Uninsured Rate History
The reality of the uninsured rate is that it is always changing.
Above we covered what is happening now, below is really just a record of changes. Feel free to skip this section if you don’t feel like looking at old data.
The uninsured rate didn’t change much much under the Affordable Care Act under Trump according to 2017 data from the CDC, the Census Bureau, and NHIS. However, between 2018 and 2019 there was a substantial change. Still, we covered that above, so let’s look a bit at the history below.
With that said, there has generally been less data released under Trump than there was under Obama. Meanwhile, some of that data shows a rise in the uninsured rate, while some doesn’t show as noticeable of an increase.
According to a Gallup poll, the uninsured rate climbed to 12.2% by the final quarter of 2017, up 1.3 points since the low point of 10.9% measured in the last quarter of 2016.
Meanwhile, the Census data (which the CDC and NHIS data mirrors) shows that there wasn’t a statistically meaningful change in total uninsured. The Census data shows that 91.2% of all demographics are insured in 2017, i.e. it shows a 8.8% uninsured rate for all demographics in 2017.
In short, we can generally say 1. the uninsured rate dropped to record lows under the ACA, but 2. the uninsured rate has not changed significantly since early 2016 according to the CDC, Census, and NHIS (I still don’t have meaningful 2018 data because as of writing this 2018 is not over yet).
It could be that when we look at 2018 data, or perhaps data for 2019 and beyond, that we see the uninsured rate rising due to changes to the ACA (for example reducing the fee for not having coverage to $0 under Trump). Likewise, it could be that we see a drop in the uninsured rate, perhaps due to expanding short term plans without repealing the ACA. We don’t have that data yet, so for now all we can do is look to 2016 and 2017 for a sense of the uninsured rate. The good news is, based on that data, we can see the uninsured rate is still near record lows under the ACA.
Below we look more at the uninsured rates over time, and we examine who the uninsured are, how not having coverage affects their lives, and how this affects our economy. We will also look at the differences between how the Affordable Care Act affected uninsured rates in states that embraced the law’s major provisions, as opposed to states who rejected them.
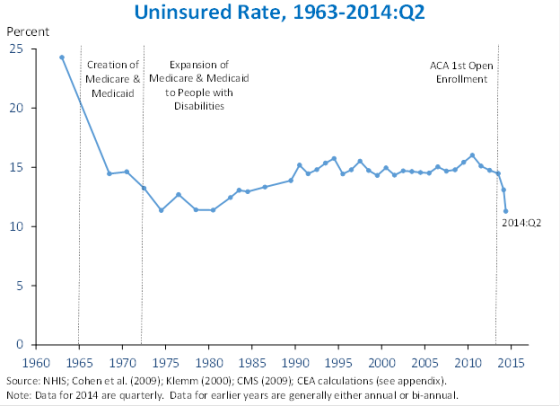
According to the CDC and Census data, for the first three months of 2016 the uninsured rate was 8.6% in 2016 down from 9.2% in 2015, and from 15.7% before the Affordable Care Act was signed into law. For just the 18 -64 demographic the same study shows the uninsured rate at 11.9%, down from 13% in 2015, down from 22.3% in 2010 when the ACA was signed into law. These represent the lowest uninsured rates in over 50 years according to the studies (which are all based on census data).
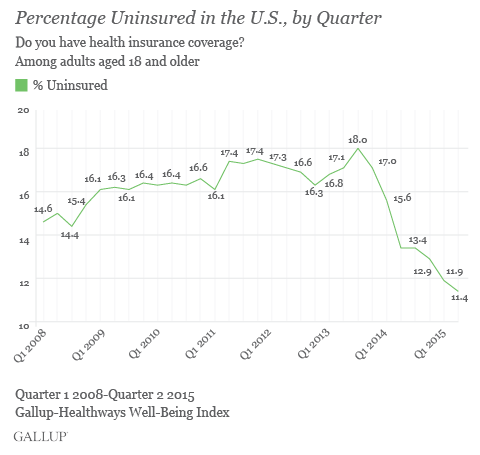
Another highly respected survey from Gallup showed that as of January of 2015, before the 2015 open enrollment period data, the uninsured rate was 12.9% on average from the fourth quarter of 2014. By the second quarter of 2015, the uninsured rate had fallen to 11.4%, down from 11.9% in the first quarter of 2015. This was down from a high of 18% and a low of 14.4% in 2008.
Both of the above studies should be taken into account when trying to understand what an exact uninsured rate is as they both rely on survey data as well as actual enrollment numbers (although I would suggest erring on the side of the Census data).
While it may seem as though ObamaCare isn’t making much of dent, that view is inaccurate. According to an April 2014 CBO report, the uninsured rate is projected to drop sharply during 2016 open enrollment as more Americans become aware of the fee and subsidies and continue to fall until around 2024.
Uninsured Rate 2016: As of first quarter of 2016 the uninsured rate is 11.9% for Americans 18 – 64 and 8.6% for all Americans.
FACT: According to a 2017 CBO Report on the American Health Care Act: In 2026, an estimated 52 million people would have been uninsured [under the Republican plan], compared with 28 million who would lack insurance that year under current law [ObamaCare] if the Republican repeal and replace plan was passed as written back in 2017.
Get more facts on the ObamaCare enrollment numbers, or keep reading about the uninsured.
Who are the Uninsured?
There is a common misconception that the uninsured are comprised of those who don’t want insurance or don’t have jobs, both of these ideas are myths. In 2012, 47.3 million people in the U.S. under age 65 lacked health insurance. The majority of these uninsured were working families who can’t afford or don’t have access to health insurance. Let’s take a look at some statistics about the uninsured:
- In 2010 16% of uninsured were full-time workers or their dependents.
- The primary reasons for Americans being uninsured are cost and job loss.
- Poor working families are the most likely to be uninsured.
- Uninsured Americans cost the American healthcare system an additional $49 billion each year. Only 12% of uninsured families pay their hospital bills in full. This includes families making over $88k a year.
- According to a 2014 Kaiser poll on the uninsured, 62% thought health insurance was very important and 22% thought it was somewhat important. Additionally, 70% of people who were uninsured thought health insurance was something they needed.
Want to learn more about the uninsured? See this study done by RWIF.org on understanding the uninsured or learn more about who the uninsured are from KFF.org.
COMPARE: Unpaid hospital bills = $49 billion in 2011. Cost of ObamaCare = $76 billion net in 2015.
The Uninsured are About 25% More Likely to Die
A 2012 familiesUSA study shows that more than 130,000 Americans died between 2005 and 2010 because of their lack of health insurance. The number of deaths due to a lack of coverage averaged three per hour and that the issue plagued every state. Other studies have shown those statistics to be high or low, but all studies agree: In America, the uninsured are more likely to die than those with insurance.
The uninsured:
- are less likely to have a usual source of care outside of the emergency room
- often go without screenings and preventive care
- often delay or go without needed medical care
- pay more for medical care
How Does ObamaCare Help the Uninsured?
Keeping the above statistics on the uninsured in mind the Affordable Care Act set out the solve the problem of working families not being able to afford insurance with three important provisions:
1. State-based exchanges (marketplaces) reduce out-of-pocket costs and premium costs by offering subsidies to low and middle-income families.
2. The expansion of Medicaid to the 138% Federal Poverty Level (FPL) allows Americas poorest working families to get coverage through Medicaid. Those with no incomes were almost all eligible for Medicaid before the law passed.
3. The “employer mandate” requires large businesses to offer coverage and tax credits offered to small businesses to subsidize coverage.
Beyond these three major provisions, the ACA includes a large number of provisions that help improve access to health insurance and health care. You can check out all the benefits of ObamaCare here.
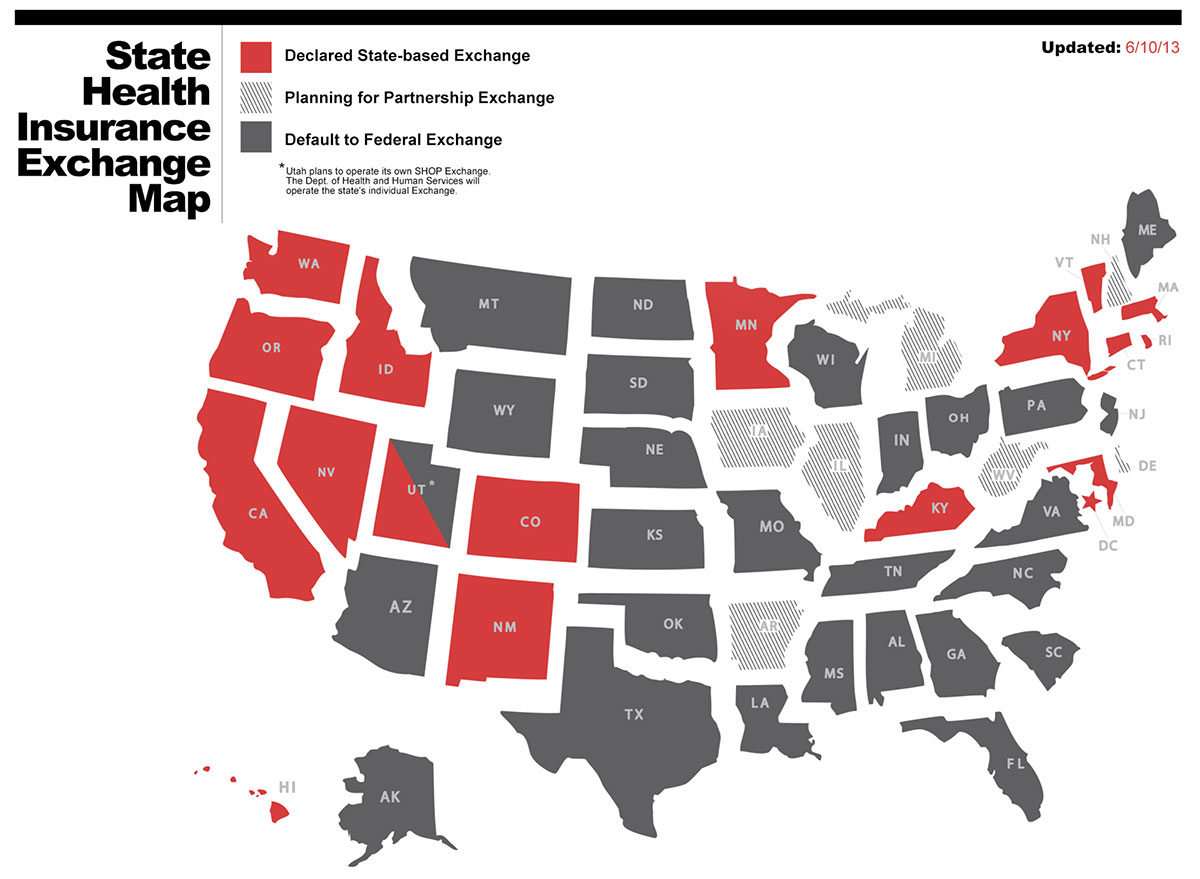
Who Rejected the Exchanges?
States could have choose to set up their own exchange as the law originally intended or they could defer to the Federal Government which would set up a marketplace for them. As it turned out only 17 states set up a marketplace, while the other 33 did not. While this didn’t necessary determine whether a state would be effective in reducing their uninsured, there was some correlation as you will see by the post-2014 open enrollment statistics on the reduction of uninsured under ObamaCare below.
Rejection of Medicaid Expansion
One of the most important provisions of the law in regards to reducing the number of uninsured people in each state was Medicaid expansion. Medicaid expansion expands Medicaid eligibility to 138% of the Federal Poverty Level (FPL) covering about half of the nation’s uninsured alone, helping to close the “Medicaid gap,” the gap between those who can afford insurance and those who qualify for Medicaid.
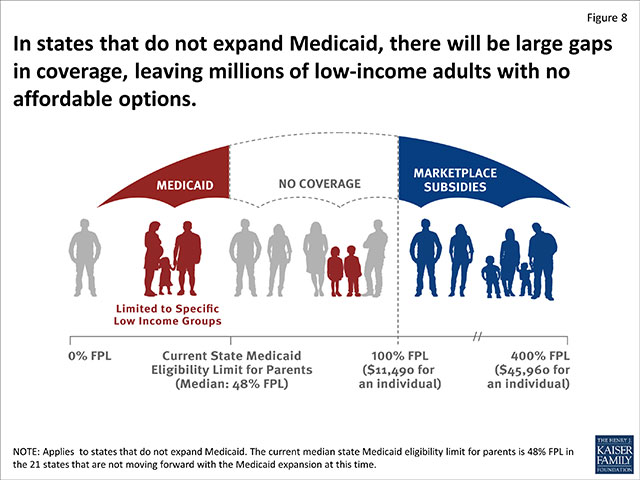
The law was originally intended to require all states to embrace expansion, but a court ruling from National Federation of Independent Business v. Sebelius allowed states to opt-out of expanding the program. The end result was 24 states rejecting expansion. Although many of the same states rejected both aspects of the program, some embraced one while rejecting the other. In many cases the states that needed it the most rejected expansion. The number one reason cited for rejecting expansion was cost.
Keep in mind the states that rejected both aspects of these programs as you look at the reduction of uninsured below. Also note, that more states are expanding each day. See an updated list here.
NOT PARTICIPATING (24 states)
- Alabama*: Gov. Robert Bentley (R)
- Alaska*: Gov. Sean Parnell (R)
- Florida*: Gov. Rick Scott (R)
- Georgia*: Gov. Nathan Deal (R)
- Idaho*: Gov. C.L. Otter (R)
- Indiana: Gov. Mike Pence (R)
- Kansas: Gov. Sam Brownback (R)
- Louisiana*: Gov. Bobby Jindal (R)
- Maine*: Gov. Paul LePage (R)
- Mississippi*: Gov. Phil Bryant (R)
- Montana: (R)
- Nebraska*: Gov. Dave Heineman (R)
- North Carolina: Gov. Pat McCrory (R)
- Oklahoma: Gov. Mary Fallin (R)
- Pennsylvania*: Gov. Tom Corbett (R)
- South Carolina*: Gov. Nikki Haley (R)
- South Dakota: Gov. Dennis Daugaard (R)
- Tennessee: Gov. Bill Haslam (R)
- Texas*: Gov. Rick Perry (R)
- Utah: Gov. Gary Herbert (R)
- Vermont: Gov. Peter Shumlin (D)
- Virginia: Gov. Bob McDonnell (R)
- Wisconsin*: Gov. Scott Walker (R)
- Wyoming*: Gov. Matt Mead (R)
PARTICIPATING (26 states and the District of Columbia)
- Arizona*: Gov. Jan Brewer (R)
- Arkansas: Gov. Mike Beebe (D)
- California: Gov. Jerry Brown (D)
- Colorado*: Gov. John Hickenlooper (D)
- Connecticut: Gov. Dannel Malloy (D)
- Delaware: Gov. Jack Markell (D)
- District of Columbia: D.C. Mayor Vincent Gray (D)
- Hawaii: Gov. Neil Abercrombie (D)
- Illinois: Gov. Pat Quinn (D)
- Iowa*: Gov. Terry Branstad (R)
- Kentucky: Gov. Steve Beshear (D)
- Maryland: Gov. Martin O’Malley (D
- Massachusetts: Gov. Deval Patrick (D)
- Michigan*: Gov. Rick Snyder (R)
- Minnesota: Gov. Mark Dayton (D)
- Missouri: Gov. Jay Nixon (D)
- Montana: Gov.-elect Steve Bullock (D)
- Nevada*: Gov. Brian Sandoval (R)
- New Jersey: Gov. Chris Christie (R)
- New Hampshire: Gov. Maggie Hassan (D)
- New York: Gov. Andrew Cuomo (D)
- New Mexico: Gov. Susana Martinez (R)
- North Dakota*: Gov. Jack Dalrymple (R)
- Ohio*: Gov. John Kasich (R)
- Oregon: Gov. John Kitzhaber (D)
- Rhode Island: Gov. Lincoln Chaffee (I)
* indicates a state’s participation in the multi-state lawsuit against ACA
Go Here For Governor’s Statements on the Medicaid Expansion.
The Employer Mandate and Small Business Tax Credits
While tax credits offered to small businesses have been helping to allow small businesses to afford to offer health coverage since 2010, the employer mandate has been pushed back time and time again. The mandate, while important to reducing the uninsured, is pretty controversial and is currently the basis of a lawsuit against the President. Regardless of the suit, the truth is neither side of the aisle has embraced this aspect of the law. We, as a nation, need to decide if business should be in charge of providing health insurance. If not then we need another solution.
Learn more about the recent employer mandate lawsuit here.
Reduction in Uninsured By State
States that rejected both the exchanges and Medicaid expansion, unsurprisingly, tended to see the lowest reduction in uninsured while those who embraced both saw the biggest changes. Of course, every state has its own story.
• Massachusetts embraced reform before the rest of the country with “RomneyCare” and thus saw small reductions to their already low uninsured rate.
• Those who fared the worst, like Mississippi, already had one of the largest uninsured populations in the country and would have had one of the biggest concerns with the cost of the program.
The following statistics are from wallethub.com and are taken from data they have collected and analyzed including a recent study by the Kaiser Family Foundation (KFF).
State by State Reduction in Uninsured 2014
|
Uninsured Rank |
State Name |
Uninsured Rate Pre-Obamacare |
Projected Uninsured Rate Post-Obamacare |
Difference Before and After |
|---|---|---|---|---|
| 1 | Massachusetts | 4.35% | 1.20% | -3.16% |
| 2 | Rhode Island | 14.34% | 5.60% | -8.73% |
| 3 | District of Columbia | 9.09% | 6.29% | -2.80% |
| 4 | Hawaii | 9.11% | 6.35% | -2.75% |
| 5 | Oregon | 16.91% | 6.38% | -10.54% |
| 6 | West Virginia | 17.34% | 6.59% | -10.74% |
| 7 | Minnesota | 10.07% | 6.61% | -3.47% |
| 8 | Iowa | 11.58% | 7.47% | -4.11% |
| 9 | Washington | 16.01% | 8.27% | -7.73% |
| 10 | Kentucky | 17.30% | 8.95% | -8.35% |
| 11 | Colorado | 16.54% | 9.02% | -7.52% |
| 12 | Maryland | 14.91% | 9.13% | -5.77% |
| 13 | Wisconsin | 11.64% | 9.75% | -1.89% |
| 14 | New York | 13.39% | 10.16% | -3.23% |
| 15 | Pennsylvania | 13.27% | 11.05% | -2.22% |
| 16 | Ohio | 15.19% | 11.27% | -3.92% |
| 17 | Virginia | 14.91% | 12.45% | -2.46% |
| 18 | Tennessee | 15.70% | 12.46% | -3.24% |
| 19 | Indiana | 14.80% | 12.78% | -2.02% |
| 20 | Kansas | 15.46% | 12.91% | -2.55% |
| 21 | Missouri | 16.49% | 12.95% | -3.55% |
| 22 | New Jersey | 16.83% | 13.54% | -3.29% |
| 23 | Utah | 15.96% | 13.57% | -2.38% |
| 24 | Nebraska | 14.71% | 13.69% | -1.02% |
| 25 | Arkansas | 20.87% | 13.77% | -7.10% |
| 26 | South Carolina | 19.25% | 13.97% | -5.28% |
| 27 | Illinois | 16.16% | 14.16% | -2.01% |
| 28 | California | 21.00% | 14.26% | -6.74% |
| 29 | Idaho | 19.12% | 14.41% | -4.72% |
| 30 | South Dakota | 15.88% | 14.71% | -1.17% |
| 31 | Alabama | 15.97% | 15.44% | -0.53% |
| 32 | Arizona | 20.13% | 16.38% | -3.74% |
| 33 | North Carolina | 19.64% | 16.68% | -2.96% |
| 34 | Montana | 21.98% | 17.65% | -4.34% |
| 35 | Georgia | 21.66% | 18.16% | -3.50% |
| 36 | Wyoming | 18.92% | 18.29% | -0.63% |
| 37 | Oklahoma | 19.76% | 18.33% | -1.43% |
| 38 | Alaska | 20.48% | 18.96% | -1.52% |
| 39 | Nevada | 26.52% | 19.58% | -6.94% |
| 40 | New Mexico | 24.29% | 19.59% | -4.69% |
| 41 | Florida | 24.73% | 19.61% | -5.12% |
| 42 | Louisiana | 22.41% | 20.91% | -1.50% |
| 43 | Mississippi | 18.11% | 21.46% | 3.34% |
| 44 | Texas | 26.80% | 24.81% | -1.99% |
| N/A | Connecticut | 9.50% | N/A | N/A |
| N/A | Delaware | 12.22% | N/A | N/A |
| N/A | Maine | 11.53% | N/A | N/A |
| N/A | Michigan | 13.46% | N/A | N/A |
| N/A | New Hampshire | 14.16% | N/A | N/A |
| N/A | North Dakota | 11.80% | N/A | N/A |
| N/A | Vermont | 9.28% | N/A | N/A |
| NATIONAL | 17.87% | 14.22% | -3.66% |
State by State Uninsured Rate By Source 2014
|
State Name |
Uninsured Pre Obamacare |
Projected Uninsured (RAND 28%) |
Projected Uninsured (McKinsey 36%) |
Projected Uninsured (Kaiser 57%) |
Projected Uninsured (HHS 87%) |
|---|---|---|---|---|---|
| Alabama | 15.97% | 16.13% | 15.94% | 15.44% | 14.73% |
| Alaska | 20.48% | 19.55% | 19.39% | 18.96% | 18.35% |
| Arizona | 20.13% | 17.00% | 16.83% | 16.38% | 15.75% |
| Arkansas | 20.87% | 14.29% | 14.14% | 13.77% | 13.24% |
| California | 21.00% | 15.48% | 15.15% | 14.26% | 12.99% |
| Colorado | 16.54% | 9.84% | 9.61% | 9.02% | 8.18% |
| Connecticut | 9.50% | N/A | N/A | N/A | N/A |
| Delaware | 12.22% | N/A | N/A | N/A | N/A |
| District of Columbia | 9.09% | 6.85% | 6.70% | 6.29% | 5.70% |
| Florida | 24.73% | 21.43% | 20.93% | 19.61% | 17.72% |
| Georgia | 21.66% | 19.23% | 18.94% | 18.16% | 17.05% |
| Hawaii | 9.11% | 6.57% | 6.51% | 6.35% | 6.12% |
| Idaho | 19.12% | 16.04% | 15.59% | 14.41% | 12.72% |
| Illinois | 16.16% | 14.73% | 14.57% | 14.16% | 13.56% |
| Indiana | 14.80% | 13.49% | 13.29% | 12.78% | 12.04% |
| Iowa | 11.58% | 7.80% | 7.71% | 7.47% | 7.14% |
| Kansas | 15.46% | 13.60% | 13.41% | 12.91% | 12.19% |
| Kentucky | 17.30% | 9.60% | 9.42% | 8.95% | 8.29% |
| Louisiana | 22.41% | 21.67% | 21.46% | 20.91% | 20.12% |
| Maine | 11.53% | N/A | N/A | N/A | N/A |
| Maryland | 14.91% | 9.52% | 9.41% | 9.13% | 8.73% |
| Massachusetts | 4.35% | 1.36% | 1.32% | 1.20% | 1.03% |
| Michigan | 13.46% | N/A | N/A | N/A | N/A |
| Minnesota | 10.07% | 6.91% | 6.83% | 6.61% | 6.29% |
| Mississippi | 18.11% | 22.17% | 21.97% | 21.46% | 20.72% |
| Missouri | 16.49% | 13.82% | 13.58% | 12.95% | 12.04% |
| Montana | 21.98% | 18.95% | 18.59% | 17.65% | 16.30% |
| Nebraska | 14.71% | 14.48% | 14.26% | 13.69% | 12.88% |
| Nevada | 26.52% | 20.15% | 19.99% | 19.58% | 19.00% |
| New Hampshire | 14.16% | N/A | N/A | N/A | N/A |
| New Jersey | 16.83% | 14.17% | 14.00% | 13.54% | 12.89% |
| New Mexico | 24.29% | 20.13% | 19.98% | 19.59% | 19.04% |
| New York | 13.39% | 10.81% | 10.63% | 10.16% | 9.49% |
| North Carolina | 19.64% | 17.96% | 17.61% | 16.68% | 15.36% |
| North Dakota | 11.80% | N/A | N/A | N/A | N/A |
| Ohio | 15.19% | 11.74% | 11.61% | 11.27% | 10.79% |
| Oklahoma | 19.76% | 18.96% | 18.79% | 18.33% | 17.69% |
| Oregon | 16.91% | 6.97% | 6.81% | 6.38% | 5.76% |
| Pennsylvania | 13.27% | 11.91% | 11.67% | 11.05% | 10.17% |
| Rhode Island | 14.34% | 6.55% | 6.29% | 5.60% | 4.62% |
| South Carolina | 19.25% | 14.83% | 14.59% | 13.97% | 13.08% |
| South Dakota | 15.88% | 15.25% | 15.10% | 14.71% | 14.15% |
| Tennessee | 15.70% | 13.27% | 13.04% | 12.46% | 11.62% |
| Texas | 26.80% | 25.74% | 25.48% | 24.81% | 23.85% |
| Utah | 15.96% | 14.54% | 14.27% | 13.57% | 12.58% |
| Vermont | 9.28% | N/A | N/A | N/A | N/A |
| Virginia | 14.91% | 13.37% | 13.12% | 12.45% | 11.51% |
| Washington | 16.01% | 9.07% | 8.85% | 8.27% | 7.45% |
| West Virginia | 17.34% | 6.97% | 6.87% | 6.59% | 6.21% |
| Wisconsin | 11.64% | 10.58% | 10.35% | 9.75% | 8.89% |
| Wyoming | 18.92% | 18.99% | 18.80% | 18.29% | 17.56% |
| NATIONAL | 17.87% | 15.08% | 14.85% | 14.22% | 13.32% |
FACT: By 2024, when the law is theoretically fully in effect and uninsured is at its lowest, 25% of the uninsured will qualify for Medicaid. They will either be in a non-expansion state (5%), or won’t know about, or won’t get, free or low-cost coverage despite being eligible (20%).
Learning More About the Uninsured
Aside from the Gallup Poll and Kaiser Studies mentioned on this page, reliable sources for learning about the uninsured are the official HHS blog and the longest running non-federal healthcare survey, Commonwealth Fund. This 2014 article from the NYtimes from 2014 also has a breakdown of uninsured facts state-by-state. Or learn more about Understanding ObamaCare enrollment numbers.
How to Reduce the Uninsured Rates Moving Forward
To reduce the uninsured rate in America, it will require that we as a country, and that includes each state, move toward expanding Medicaid and either embracing the employer mandate or simply find a better solution. While we as a country fight over whether the law should be or not exist, millions of hard working Americans are going without coverage. Learn more facts about the uninsured and the Affordable Care Act now on our ObamaCare Facts page.
Who are the Uninsured and How is the ACA Helping?
![]()
- Key Facts about the Uninsured Population. KFF.org.
- Health Insurance Coverage in the United States: 2018. Census.gov.
Author: Thomas DeMichele
Thomas DeMichele is the head writer and founder of ObamaCareFacts.com, FactsOnMedicare.com, and other websites. He has been in the health insurance and healthcare information field since 2012. ObamaCareFacts.com is a...
Thomas DeMichele's Full Bio