ObamaCare Enrollment Numbers As of March 2015


16.4 million uninsured gained health insurance under the Affordable Care Act (ObamaCare) for a 35% reduction in uninsured as of March 2015. The information below is based on a report done by aspe.hhs.gov that includes Marketplace, Medicaid, and CHIP enrollment data paired with survey data (as explained below).
Overview of 2015 Enrollment Number Data
- The report estimates 16.4 million uninsured gained coverage under the ACA since 2010.
- 11.7 are currently enrolled in state and federal Marketplaces. Some percentage would be expected to not continue coverage for the full calendar year, while many more will enroll in special enrollment.
- 5.7 million young adults (aged 19-25) stayed on a parent’s plan until age 26. That is 2.3 million who stayed on their parents plan from 2010 to 2013 with an estimated 3.4 million gaining coverage from 2013 to 2015.
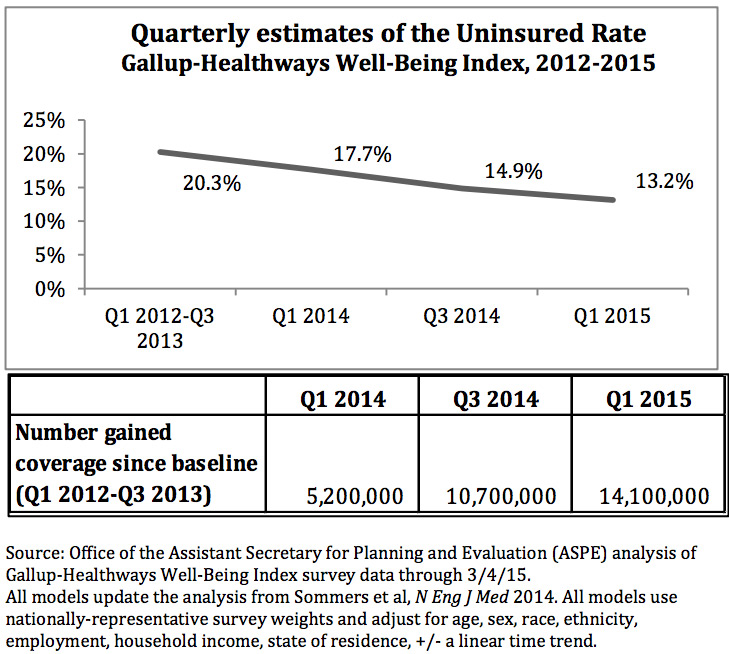
- 14.1 million adults gained health insurance since the beginning of open enrollment in October, 2013 through March 4, 2015. Adding in the 2.3 million from 2010 to 2013 we get 16.4 million.
- There were 10.8 million Medicaid and CHIP enrollments since October 2013. The uninsured rate dropped more in states that expanding Medicaid.
- Generally adults with incomes above 400% of the federal poverty level saw little to no change in uninsured rate (as it was already at about 98%).
- About 4.5 million lost their plan in 2013, so some amount of Marketplace enrollments were this group.
- Millions more enrolled in individual plans due to the individual mandate and through plans offered by employers due to the employer mandate.
- The current uninsured rate is a little over 12%, although the study below cites 13.2%. Although an estimate based on survey data, this percentage does account for everything from Medicaid to plan drops.
- Before the ACA around 47 million lacked health coverage.
Overview of 2015 ObamaCare Enrollment Numbers From the Report
Current estimates show the total of newly insured to be 16.4 million bringing the uninsured rate down from a high of 20.3% to 13.2% at the start of the 1st quarter of 2015. This doesn’t take into account those who will enroll in special enrollment or in the “extra enrollment period” from March 15 – April 30.
Please be aware, while the Marketplace and Medicaid numbers are fairly accurate, uninsured percentages and other enrollments are estimates based off of available data and surveys.
The 20.3% uninsured rate was a recent high and was partially affected by people losing their plans. A more accurate uninsured rate pre-ACA was 15%. Current 1st quarter projections are also a whole percentage point lower than quoted in the HHS report. Gallup reports the uninsured rate at 12.3% currently. It’s important to understand that the uninsured rates are based on survey data and are estimates, while enrollment numbers for the Marketplace, Medicaid, and CHIP are based on HHS and CMS data and are more exact. Still, regardless of how you look at the data it shows the uninsured rate is going down and it’s dropping faster in states that embraced healthcare reform by expanding Medicaid.
A Breakdown of the HHS Report From March 16 2015 on Current ObamaCare Enrollment Numbers
14.1 million adults gained health insurance since the beginning of open enrollment in October, 2013 through March 4, 2015. This includes 11.7 marketplace enrollments, 2.3 million who stayed on their parents plan from 2010 to October 2013, and 3.4 million estimated to have stayed on their parents plan from October 2013 until March 2015.
- The above numbers don’t include Medicaid and CHIP enrollments which increased by over 10 million due to Medicaid expansion, sign ups due to employer mandate, and those who enrolled outside of the Marketplace.
- Those numbers don’t specifically include those who lost their plans, or those who transitioned from a non-marketplace plan to a Marketplace plan.
- According to Gallup, since October 2013 the uninsured rate dropped from 20.3 percent to 13.2 percent – a 35 percent (or 7.1 percentage point) reduction in the uninsured rate.
- While the 14.1 million number only refers to the Marketplace and young adult sign ups, the Gallup data takes into account all enrollments and those who lost their plans.

Additional Detail on Coverage Gains Since the Start of the First Open Enrollment Period in Oct. 2013: Uninsured Rates by Race & Ethnicity
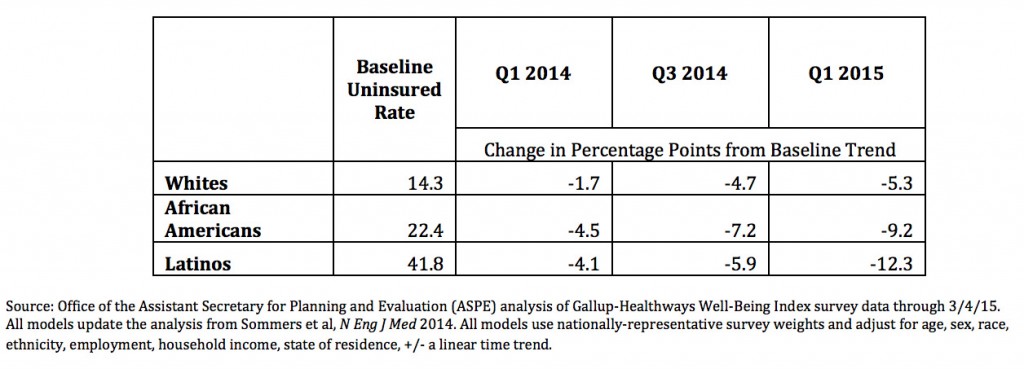
The uninsured rate declined across all race/ethnicity categories since the baseline period.
- There was a greater decline among African Americans and Latinos than among Whites.
- Among Whites, the uninsured rate declined by 5.3 percentage points against a baseline uninsured rate of 14.3 percent, resulting in 6.6 million adults gaining coverage.
- Among African Americans, the uninsured rate declined by 9.2 percentage points against a baseline uninsured rate of 22.4 percent, resulting in 2.3 million adults gaining coverage.
- Among Latinos, the uninsured rate dropped by 12.3 percentage points against a baseline uninsured rate of 41.8 percent, resulting in 4.2 million adults gaining coverage.

Additional Detail on Coverage Gains Since the Start of the First Open Enrollment Period in Oct. 2013: Uninsured Rates by State Medicaid Expansion Status & Household Income
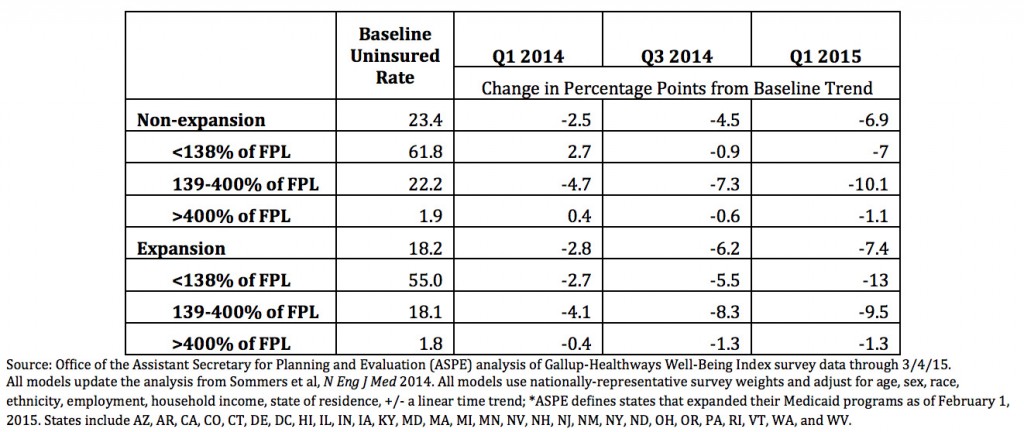
Health insurance coverage gains were especially strong in Medicaid expansion states and were concentrated among low and middle income population groups in all states. This was particularly true in expansion states where families with incomes of 138 percent of poverty or less had the lowest rates of health insurance coverage prior to the coverage expansion (55 percent were uninsured) and the largest gain in coverage after expansion — a 13 percentage point increase, nearly twice the percentage point increase that occurred in non-expansion states (7 percentage points). There was little or no change in coverage among people with incomes above 400% of FPL, with more than 98% continuing to have insurance coverage in both expansion and non-expansion states.
- Non-expansion states had an average baseline uninsured rate of 23.4 percent with a drop of 6.9 percentage points. Families with incomes between 139-400 percent of FPL had the largest drop at 10.1 percentage points.
- Expansion states had an average baseline uninsured rate of 18.2 percent with a drop of 7.4 percentage points. Families with incomes at 138 percent of poverty or less had the largest drop at 13 percentage points.

Young Adult Coverage
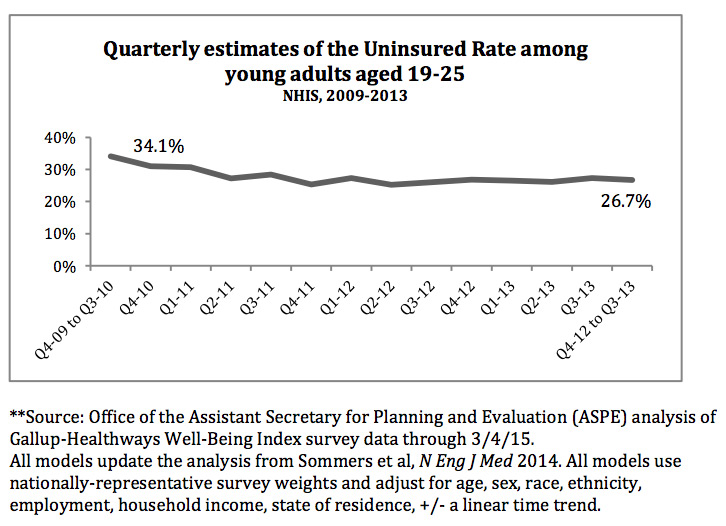
Young Adults: Coverage gains for young adults aged 19-25 started in 2010 with the ACA’s provision enabling them to stay on their parents’ plans until age 26. From the baseline period through the start of open enrollment in 2013, the uninsured rate dropped from 34.1% to 26.7%, which translates to 2.3 million young adults gaining coverage.*
- Since October 2013, an additional 3.4 million young adults aged 19-25 gained coverage.**
- In total, an estimated 5.7 million young adults gained coverage from 2010 through March 4, 2015.
*Source: National Health Interview Survey; see technical notes for methods

dj brooks
I’m confused.
So the gov’t says 17.6 m gained coverage. That includes federal and state market places, young adults allowed to stay, medicaid, and other coverage provisions. 5.7m for young adults, 10.8m for expanded medicaid.
12.7 enrolled in market places. It doesn’t add up.
“Enrolled” is not a useful number since cancelations happen.
How much gained in each category?
ObamaCareFacts.comThe Author
It is a little more complex than that. The ACA did many things to expand coverage, count them all together and you get 20 million plus (the number changes over time).
See here: https://obamacarefacts.com/sign-ups/obamacare-enrollment-numbers/
Consider: a May 2015 RAND Corporation study estimated that 22.8 million got coverage while 5.9 million lost plans for a net total of 16.9 million newly insured. 9.6 million people enrolled in employer-sponsored health plans, followed by Medicaid (6.5 million), the individual marketplaces (4.1 million), non-marketplace individual plans (1.2 million) and other insurance sources (1.5 million). To clarify that is 4.1 million newly enrolled in the Marketplace and 7.1 who transitioned to Marketplace coverage for a total of 11.2 million.
Since then numbers have increased, but that should give you an idea of how to understand the data.
David Standeffer
How does one find doctors who are willing to take ACA coverage in Deep South states where information is not published?
ObamaCareFacts.comThe Author
That is a really great question. I don’t know much about the Deep South, I very purposefully live as far away as possible while still living in America (Washington State, not Hawaii or Alaska).
Ben
Is there any data on how many H-2A visa holders were enrolled in 2014? If there is, could you point me in the direction of where these numbers may be housed? Thanks!
David Guel
Why are these numbers not published by our news media?
ObamaCareFacts.comThe Author
People I think like to cherry pick numbers to fit their narrative. In general HHS provides some of the best data, but there are some really insightful private studies. The important thing is to understand the effects of each coverage provisions and take into account plan drops.
For the most up-to-date tally, and to see the progression of numbers, see this page: https://obamacarefacts.com/sign-ups/obamacare-enrollment-numbers/
Carol E. Neikam
I am a senior citizen with a low-income.
I only have regular Medicare now, and I need additional coverage to be able to afford to go the doctors.
Do I need to sign up for Obamacare?
Would it be more affordable for me to have Obamacare, and how would that work for me?
Thank you.
ObamaCareFacts.comThe Author
When you have Medicare you have to get all your additional (supplemental) coverage from Medicare. So you’ll want to look into Part D with Medigap, or simply look at Part C with drug coverage. If you wait to get covered your costs may go up, and some of the costs work on a sliding scale if you are low income.
If you don’t have access to Medicare then you may have Medicaid and ObamaCare options.
George Lester
How many are now enrolled (total) in the Affordable Care Act? How many do you expect to sign up during the sign-up period that will begin in a few months?
My wife was on “Obamacare” for 3 months – until she turned 65 and went on Medicare, so I like to keep track of how things are going. (We were VERY happy with her “Obamacare.”)
We called one of the exchanges to find out how much a Silver plan for a family of 4 would cost, and were pleasantly surprised. It was much less than the “Obamacare Haters” said it was.
Keep up the good work.
George Lester
ObamaCareFacts.comThe Author
The enrollment numbers ebb and flow throughout the year as people enroll in special enrollment and drop plans. Last count was around 17 million in the Marketplace and Medicaid. The CBO has predicted total enrollments a few times and the numbers are potentially higher if we look at the effects of the employer mandate (according to some studies). If you want to research it more you can check out our enrollment numbers page or see page 107 of the CBO forecast from 2014 https://www.cbo.gov/sites/default/files/cbofiles/attachments/45010-breakout-AppendixB.pdf
https://obamacarefacts.com/sign-ups/obamacare-enrollment-numbers/
One thing is for sure the enrollment numbers will keep going up as long as the law remains intact and that it will balance off at a point (unfortunately before we ever see 100% coverage as their will always be a “churn” of people who have access and don’t sign up, drop their plans, forget to pay, or choose not to have coverage for any reason).
alphonso evansa
I think the Obama care should be upgraded to include better insurances with no out pocket expense too. T