ObamaCare Enrollment Numbers


Get the Facts on ACA Sign-Ups (Updated for 2022)
The information on ObamaCare sign-ups and enrollments is here. Let’s look at the ObamaCare enrollment numbers and figure out who signed up, who enrolled, who paid, who lost coverage, who got subsidies, what type of coverage people got, and where they got it.
A Summary of the Current ObamaCare Enrollment Numbers
Generally speaking: The ACA has increasingly reduced the uninsured rate. Despite the ebb and flow each year (as plans drop during the year and special enrollment is utilized), and despite some increase in the uninsured rate at points, the total uninsured rate reached an all-time lower under the ACA and continues to remain below pre-ACA levels.
As for how many are covered under ObamaCare here in 2022?
“Over 20 million” is a rough estimate of how many are currently covered between all coverage provisions under the Affordable Care Act here in 2022.
Here is the logic:
About 10.25 million were covered via HealthCare.Gov alone (the federal marketplace) in 2022. That is compared to 8.2 million in 2021, 8.3 million in 2020, 8.4 million in 2019, 8.7 million in 2018, 9.2 million in 2017, and 9.6 million in 2016 (prior to 2016 enrollments had increased each year).
With that said, the above numbers only reference the federal marketplace healthcare.gov. They do not include for example the state-based marketplaces which account for about 25% of individuals and families covered by the private market each year.
For example, the total in HealthCare.Gov and state marketplaces for 2022 was 14.5 million. Meanwhile, it was 11.4 million in 2020, which was for example down from 11.45 million in 2019, 11.75 million in 2018, 12.2 million in 2017, and 12.6 million in 2016.
Further, those numbers don’t count those who were eligible for Medicaid coverage due to Medicaid expansion (for 2019, for example, it was 14.8 million covered by expansion with 12 million of those being newly eligible for coverage under expansion who were not eligible before).
Lastly, the above numbers don’t count other coverage provisions. For example, 2.6 million enrollments were from young adults staying on their parents’ plan, and the many who were newly covered via the employer mandate (we don’t have a recent estimate, however in 2015 RAND estimated 9.6 million).
Altogether, those covered under ACA coverage provisions (federal and state marketplaces, Medicaid expansion, staying on a plan until 26, employer coverage expansion, etc) is well over 20 million in 2022 based on the figures explained above (14.5 + 12 + 2.6 + x = well over 20 million). In fact, the number is likely substantially higher since I didn’t count those covered under the employer mandate in that count and instead just represented it as ‘x’! Further, consider also, those numbers alone add up to almost 30 million. This could easily make the total covered due to the ACA closer to 40 million. The idea here is to give a quick estimate everyone can agree on.
The above is true despite the fact that there was a net increase in the uninsured rate since 2016 (the increase to the uninsured rate is mainly due to the fee for not having health insurance being eliminated on a federal level starting in 2019).
The above is also true despite the fact that marketplace enrollments had been getting slightly lower every year until 2022 where the expansion of enrollment dates and assistance under Biden and pressure from COVID likely increased sign-ups.
In short, “over 20 million” is a conservative and general estimate, as if the 9.6 million estimate of employer coverage is even close to right, the number is clearly much higher (even with slight declines in marketplace coverage considered).
With the above said, the specific enrollment numbers change based on what report we are discussing, what methodology they are using, what demographics are being considered, and what months we are talking about (and if we are using average or current numbers).
Below we cover some of the details on how to properly understand the data, and offer some estimates of the impact of the employer mandate, but for those who just want a ballpark figure, “over 20 million” and the specifics given above are a solid current estimate.
Please note a lot of the data below is from past years, as we have to wait for new polls and data to update this page. So hopefully the above info gave you a clear enough overview to get a good sense of how the ACA has impacted the uninsured and how things change over time.
FACTS ON THE UNINSURED: According to Gallup data, the uninsured rate of the 18-64 demographic under the Affordable Care Act (ObamaCare) dropped to record lows of 10.9% in 2016 but rose to 13.7% in 2019. Meanwhile, according to the Kaiser Family Foundation, the number of uninsured nonelderly Americans decreased from over 46.5 million in 2010 to just below 27 million in 2016 under ObamaCare. However, since 2016 the number of uninsured has decreased, especially with Americans who don’t qualify for cost assistance.
Notes on how to understand the current enrollment numbers and how a repeal and replace would affect the uninsured rates: Above we offered an estimate of total enrollments under all ACA coverage provisions. The reality is that total enrollments under all ACA provisions were likely considerably higher than 20 million in 2019. However, one has to factor in plan drops at the start of the ACA (about 6 million of which about 4 million re-enrolled), and one has to consider those who would have got coverage without the ACA, plus a slight increase in the number of uninsured under the Trump administration. Those two points together still make “20 million-plus” a reasonable estimate.
UPDATE 2019: The total ensured number seems to be declining. CMS data from 2019 shows that marketplace enrollment was down by 1.2 million for 2017 – 2018 for those who didn’t qualify for cost assistance. However, it was up 300,000 for those that did qualify. Unless those who didn’t use the marketplace got covered by other means, it implies that total enrollment in individual and family private coverage was down. This is likely impacted by 1. rising costs, and 2. the fee for not having coverage being reduced to zero.
ObamaCare Enrollment and Sign-Up Numbers Quick Facts
NOTE: From here out there is a lot of historic data, since enrollment numbers are constantly changing. Historic data can be useful, but check above for the current numbers.
Below are some quick facts that will help you understand how the enrollment numbers for the Affordable Care Acts’s major coverage provisions work. We are always updating this section, as actual enrollment numbers change all the time due to enrollments and plan drops. Keep in mind that our current totals rely on studies by both official entities like CMS and HHS and third parties like Gallup.
See the data below the quick facts section for detailed explanations and citations of numbers.
The 2020 enrollment numbers: 2019 data shows that about 8.3 million were enrolled in the federal marketplace healthcare.gov alone during open enrollment 2018.
The 2019 enrollment numbers: 2019 data shows that about 8.4 million were enrolled in the federal marketplace healthcare.gov alone during open enrollment 2018.
The 2018 enrollment numbers: 11.8 million people enrolled in the federal and state marketplaces in 2018 (including 8.7 million in HealthCare.Gov alone). Meanwhile, about 11.9 million were covered under Medicaid expansion.
The 2017 enrollment numbers: Speaking very roughly, about 20 million Americans are enrolled under all ACA coverage provisions with about 10.3 million of that coming from the federal and state marketplaces (12.2 million total enrolled or re-enrolled, but after the typical annual churn about 10.3 million remained by March 15, 2017; note initial enrollment included 3.0 million in state marketplaces and 9.2 in federal marketplaces). With that said, with Trump taking office, reporting on the ACA has taken a backseat and exact numbers are harder to come by. Still, from the data we do have, we can say that total enrollments are about what they were last year when all is said and done (some lost marketplace coverage, but others gained coverage in general under other provisions like Medicaid expansion and employer coverage, the result would very roughly be that the net enrollments are still “around 20 million”). However, with that in mind, some of the latest data on marketplace enrollments only (so not including Medicaid, those under 26, or those covered through their employer) were notably down to only 10.3 million by March 15, 2017 compared to last years 12.7 million (one can argue this data left out 500 thousand enrollees, but the grand result is marketplace-only enrollment is still lower than last year). This year Trump’s administration took the teeth out of the mandate, and thus took away some incentive to enroll. This paired with insurers dropping out of key exchanges, and other factors like readjustment payments being withheld from insurers, likely explains at least part of why enrollment went from 12.7 million high last year to 10.3 million after an initial enrollment of 12.2 million. See 2016 enrollment number for detailed info to compare 2017 numbers to.
The 2016 enrollment numbers: The enrollment numbers as of February 2016 was roughly 12.7 million in the marketplace, and very roughly 20 million plus total between the ACA between the Marketplace, Medicaid expansion, young adults staying on their parent’s plan, and other coverage provisions. TIP: The most recent report is for November 1 – December 24, 2016, that gives 11.5 million as the total in the Marketplace alone (however, that number ignores those who enrolled in January; and thus isn’t very useful). My estimate is that enrollment didn’t increase much this year, but I don’t want to speculate until if and when we see a report that includes the totals for January.
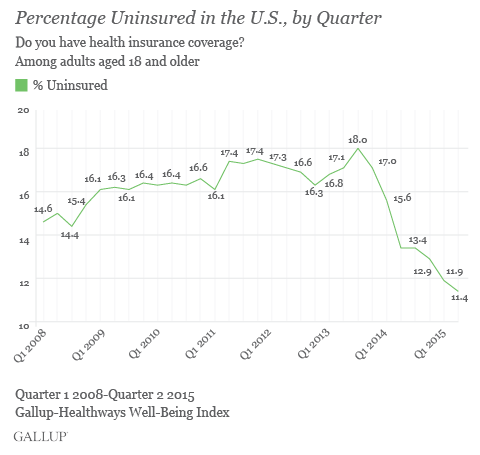
The 2016 uninsured rate remains at an all-time low with the uninsured rate at 11.9% for Americans 18 – 64 and 8.6% of all Americans 0 – 65. 8.6% is down from 9.1% as of 4th quarter 2015, and 15.7% before the Affordable Care Act was signed into law. TIP: The census says 11.9% for Q1 2016, a Gallup poll featured above says 11.4% Q1 2015, they are different studies looking at the same demographic. Marketplace signups didn’t see a net increase for 2016 (although many re-enrolled for the 12.7 million total enrolled), gains were made in other insurance types.
FACT VS. MYTH ON THE ENROLLMENT NUMBERS: Trump recently made some false claims about the CBO’s predictions and how many were covered under the ACA. Trump claimed “When #Obamacare was signed, CBO estimated that 23M would be covered in 2017. They were off by 100%. Only 10.3M people are covered.” However, the 10.3 million covered is referring to marketplace coverage only, the CBO was referring to total covered by all coverage provisions (back in their 2010 report, before they knew that the GOP would come along and block major coverage provisions like Medicaid expansion in some states). The CBO’s most recent marketplace-only enrollment projection was… 10 million. See past projections by the CBO.
TIP: The information blow mostly references the first few years of the ACA when there was a lot of information published and interest in the topic. It is still historically interesting and useful, but the information above should give you almost everything you need on the topic.
A Timeline of Enrollment Numbers
- 8 million enrolled in the Marketplaces during 2014 open enrollment (Oct 2013 to April 2014).
- 11.7 million are estimated to have enrolled in the Marketplaces during 2015 open enrollment (Nov 2014 to Feb 2015). This includes 4.5 million who re-enrolled from 2014. As of June 30, 2015, 9.9 million were still enrolled and had paid for a Marketplace plan. This is on par with HHS’s original projection of 9.1 million.
- 2016 saw a rough increase of all the 2015 numbers presented below, by January 31, Open Enrollment for 2016 coverage ended, with about 12.7 million plan selections through the Health Insurance Marketplaces (so about 1 million net increase in the private market from last years 11.7 million).
- As of March 2015, HHS reported a total of 16.4 covered due to the ACA between the Marketplace, Medicaid expansion, young adults staying on their parent’s plan, and other coverage provisions. This number was reported by HHS to have risen to 17.6 million according to September 2015 data.
- According to Gallup, the uninsured rate was 11.9% for the 18 – 65 demographic in the 1st quarter of 2015, down from a high of 18% in 2013. By the second quarter of 2015, the uninsured rate fell to 11.4%.
- According to the US Census Bureau, before the ACA in 2009 about 48.6 million or 15.7% of the population was uninsured. A 2015 study by the CDC using Census data showed the total uninsured rate as 9.2% and the uninsured rate for the 18 – 64 demographic as 13%. This would mean according to the CDC and census the uninsured rate has fallen from 15.7% to 9.2% under ObamaCare (the lowest uninsured rate in 50 years).
- In contrast to the reports above, a May 2015 RAND Corporation study estimated that 22.8 million got coverage while 5.9 million lost plans for a net total of 16.9 million newly insured. 9.6 million people enrolled in employer-sponsored health plans, followed by Medicaid (6.5 million), the individual marketplaces (4.1 million), non-marketplace individual plans (1.2 million) and other insurance sources (1.5 million). To clarify that is 4.1 million newly enrolled in the Marketplace and 7.1 who transitioned to Marketplace coverage for a total of 11.2 million.
- Many more enrolled during the “tax season 2015 special enrollment period” from March 15 – April 30, 2015. Others will drop their plan during the year, enroll under other special enrollment options, or switch coverage types.
- It’s estimated by HHS that 5.7 million young adults (aged 19-25) stayed on a parent’s plan until age 26. That is 2.3 million who stayed on their parent’s plan from 2010 to 2013 with an estimated 3.4 million gaining coverage from 2013 to 2015.
- 10.8 million more enrolled in Medicaid or CHIP since Oct 2013 (estimated at 11.7 million as of May 2015). Not all who enrolled were ineligible before the ACA but instead enrolled due to the woodworking effect (increased awareness under the ACA leading to more sign-ups). Uninsured rates dropped lower in states that expanded Medicaid.
- Wondering how much this all costs? It’s less than $5,000 per enrollee (if we include enrollees who aren’t getting subsidies, but are using the Marketplace) if we only account those getting subsidies it’s closer to $3,500 per enrollee for subsidies and $4,500 per enrollee for Medicaid and CHIP. Get the details on subsidy spending under ObamaCare.
- We don’t have exact enrollment numbers for employer coverage or enrollments outside of the Marketplace, so it can be tricky to get exact enrollment numbers. Studies on these types include a March 2015 Gallup poll shows about 1 million more covered through their employer. The same poll shows private enrollments are up but doesn’t differentiate between the marketplace and non-marketplace private coverage for individuals and families.
- We do know that adults at over 400% of the Federal Poverty Level saw little or no change in uninsured rate (it was already around 98%)
- Gallup-Healthways Well-Being Index survey data shows a current first quarter of 2015 uninsured rates to be about 12%. It’s been floating around 13% since 2014 open enrollment. The drop in uninsured is impressive versus a 2013 high of about 18% but less impressive versus a pre-ACA low of about 14.5%. Consider that 1% equals about 3.2 million people (currently the US population is about 320 million). Gallup-Healthways data is based on phone interviews, and while very accurate, is not an exact tally of uninsured.
- Before the ACA up to 47 million were uninsured.
- About 87% of the 11.4 million are getting some form of cost assistance.
- Initial enrollment estimates can be high as the enrollment numbers above don’t count those who pay their first-month premium (only about 6.5 – 7 million paid their premium in 2014).
- Initial enrollment estimates can be low as they don’t include special enrollment numbers. About a million people enrolled during special enrollment between March 31st – April 15th last year. Many more people enrolled in special enrollment throughout the year; this helped balanced off those who dropped plans.
- In 2014, 2.6 million young adults stayed on their parents’ plan. In 2015, more than 3 million did.
- In 2014, about 8 million enrolled in Medicaid. In 2015, about 11 million did.
- Millions more, who would otherwise not be insured, enrolled due to expanded coverage under the ACA and new requirements. This includes those enrolled under expanded employer coverage and those who got covered outside of the Marketplace.
- Consider that 4.5 million of 2015 enrollment were auto-enrollments.
- Consider that the HHS goal of 9.1 million for 2015 was meant to be a modest goal that accounted for fluctuations due to special enrollment and people not paying their first month premium. On the other hand, CBO projections of 13 million (revised to 12 million in January 2015, revised to 11 million in March 2015) look at average totals for the whole year (including special enrollment and plan drops), not just enrollments by the end of open enrollment.
ObamaCare Enrollment Numbers Overview
By the end of open enrollment 2014, more than 15 million Americans who didn’t have health insurance before the ACA was signed into law in 2010 were covered. This brought the total percentage of uninsured adults in the US from 18% to 13.4%. This number includes all enrollments by the uninsured – not just Marketplace enrollments.
During the year, many dropped their plans or didn’t renew them for 2015. In fact, only 4.5 million people renewed their plans on HealthCare.Gov (more on state Marketplaces later) by the end of 2014. As of January 2015, the uninsured rate was 12.9% according to Gallup (average from the fourth quarter of 2014). By the end of the 1st quarter 2015, it dropped to 11.9%. That translates to about 16.4 million Americans having coverage who wouldn’t have had coverage without the ACA. The changes have been on par with projections and are expected to decrease each year.
By the end of open enrollment 2015, an estimated 11.7 million were enrolled between the Federal and State exchanges. This is aside from the current 10 million Medicaid sign-ups, and 3 million on their parents plan by the start February 2015. While that translated to about 25 million enrollments, we are only looking at those who wouldn’t have had coverage without the ACA, hence a 16.4 estimated reduction in the uninsured rather than a 25 million. Learn more about how to understand ObamaCare enrollment numbers.
HHS originally projected 9.1 million Marketplace enrollments by February 15, 2015 (the end of Open Enrollment). The CBO projected and averaged 12 million Marketplace total enrollments throughout the year. The actual number was 11.7 million.
Enrollment Number Facts For Open Enrollment 2015
By the end of open enrollment 2015, 11.7 million were enrolled in state and federal marketplaces. 5.7 million stayed on their parent’s plan. Over 10.8 million enrolled in Medicaid or CHIP. In total that translates to about 16.4 million less uninsured with the uninsured rate falling from an 18% high in 2013 to a current 11.9% as of March 2015.
Marketplace enrollments were up from 10 million at the start of February. 4.5 million of these enrollments were auto-renews and renewals.
Federal only (HealthCare.Gov only) numbers were 7.1 million (as of Jan 16), 6.8 million (as of Jan 9, 2015), 6.6 million (as of Jan 2, 2015), 6.5 million by the end of 2014.
Federal figures on marketplace enrollments don’t include those in the 14 states which use their own marketplaces. The figure is estimated at 2.4 million as of January 16th, 2015. You can also look at the state-by-state breakdown by HHS, but the exact numbers aren’t in yet. People who got covered through Medicaid and CHIP (10 million), young adults staying on their parents’ plans (3 million), people on plans outside of the Marketplace or job-based coverage, and others in special situations are not included. Considering the enrollment numbers so far, and the fact that the employer mandate began, we expect to see a drastic decrease in the number of uninsured. We will have more detailed information as more reports come in.
- You can find more information about the HHS report on December 2014 enrollment numbers for ObamaCare here or the latest enrollment number report here. By following the HHS blog, you can get up-to-date reporting on federal marketplace enrollments and Medicaid.
- For a detailed breakdown of how each state is faring, including state by state Medicaid signups, see the HHS enrollment list.
- Find out more information on ObamaCare sign-up numbers from ACAsignups.net. This site focuses solely on enrollment statistics and discussion, and it is one of the only other non-official sources we recommend to our readers. For a quick glance of enrollment info, please see their enrollment numbers graph.
Enrollment Number Facts For Open Enrollment 2014
During open enrollment (Oct 1st, 2013 – March 31st, 2014, and then until April 19th, 2014, under special enrollment), more than 8 million Americans enrolled in a Marketplace plan. This coupled with other sign-ups under the ACA (Medicaid, CHIP, Employer-based coverage, young adults staying on their parent’s plans till 26, etc.) aggregated to increased by about 15 million of the newly insured. Below are some key factors in understanding these basic sign-up numbers.
• According to HHS, 8 million Americans enrolled in a Marketplace plan during open enrollment 2014.
• Of this 8 million, about 7.2 million were expected to have paid their first month’s premium.
- Of the more than 8 million:
- 54 percent are female, and 46 percent are male;
- 34 percent are under age 35;
- 28 percent are between the ages of 18 and 34;
- 65 percent selected a Silver plan, while 20 percent selected a Bronze plan; and,
- 85 percent selected a plan with financial assistance.
• 7 million Americans enrolled in Medicaid and CHIP with about 1.5 million waiting for their enrollment to go through.
• Almost 1 million more were enrolled earlier in Medicaid Expansion plans in seven states.
• Taking into account those who lost eligibility, enrollments in either Medicaid or CHIP increased by over 6 million during open enrollment.
• About 2.6 million young people under 26 were able to enroll on their parents’ plan.
• An April Gallup poll showed the current uninsured rate among adults dropped to 13.4% during open enrollment 2014 in the health insurance marketplace. Their May poll confirmed this number. This was due, in part, to all of the ACA-related provisions – not just the marketplace.
• Many other factors contributed to the final sign-up numbers, including the people who lost their plans, those who got employer-based insurance, those who enrolled in Medicaid early, those who are enrolling late, etc.
Enrollments for 2016 and Beyond
In the Updated Estimates of the Effects of the Insurance Coverage Provisions of the Affordable Care Act, January 2015, the CBO and JCT estimated that coverage through the exchanges to be at an average of 6 million for 2014 (taking into account plan loss and special enrollment). That number is projected to increase to an average of 12 million people in 2015, 21 million in 2016, and 24 – 25 million in each year between 2017 and 2024. Roughly three-quarters of those enrollees are expected to receive exchange subsidies. These totals represent the whole of the calendar year, not enrollments at any given date. This shouldn’t be confused with total enrollments in any type of coverage. Those numbers are similar, thereby resulting in 26 million more insured under the ACA by 2017 than without it. (NOTE: Estimates are different in past CBO reports, such as the April 2014 ACA coverage provision projections)
Enrollment is expected to increase as people respond to subsidies and to penalties for failure to obtain coverage. The same report shows a decline in baseline projections on the ACA’s cost and lower premium prices than originally projected in 2010 or 2013.
The report also shows that, despite the increase in insurance coverage through the marketplace, about 31 million non-elderly are expected to be uninsured by 2024. For that year, only 31 million are projected to be uninsured as opposed to 57 million without the ACA. The uninsured number for that year includes 30% unauthorized immigrants and 5% ineligible for Medicaid due to states refusing expansion. Surprisingly perhaps, the remaining 65% will have coverage options and choose not to take advantage of them. This includes 20% who are eligible for Medicaid but are projected not to sign-up and 45% who will have access to marketplace, work-based, or non-marketplace coverage but will choose not to obtain health insurance regardless.
More ObamaCare Sign-Up Statistics
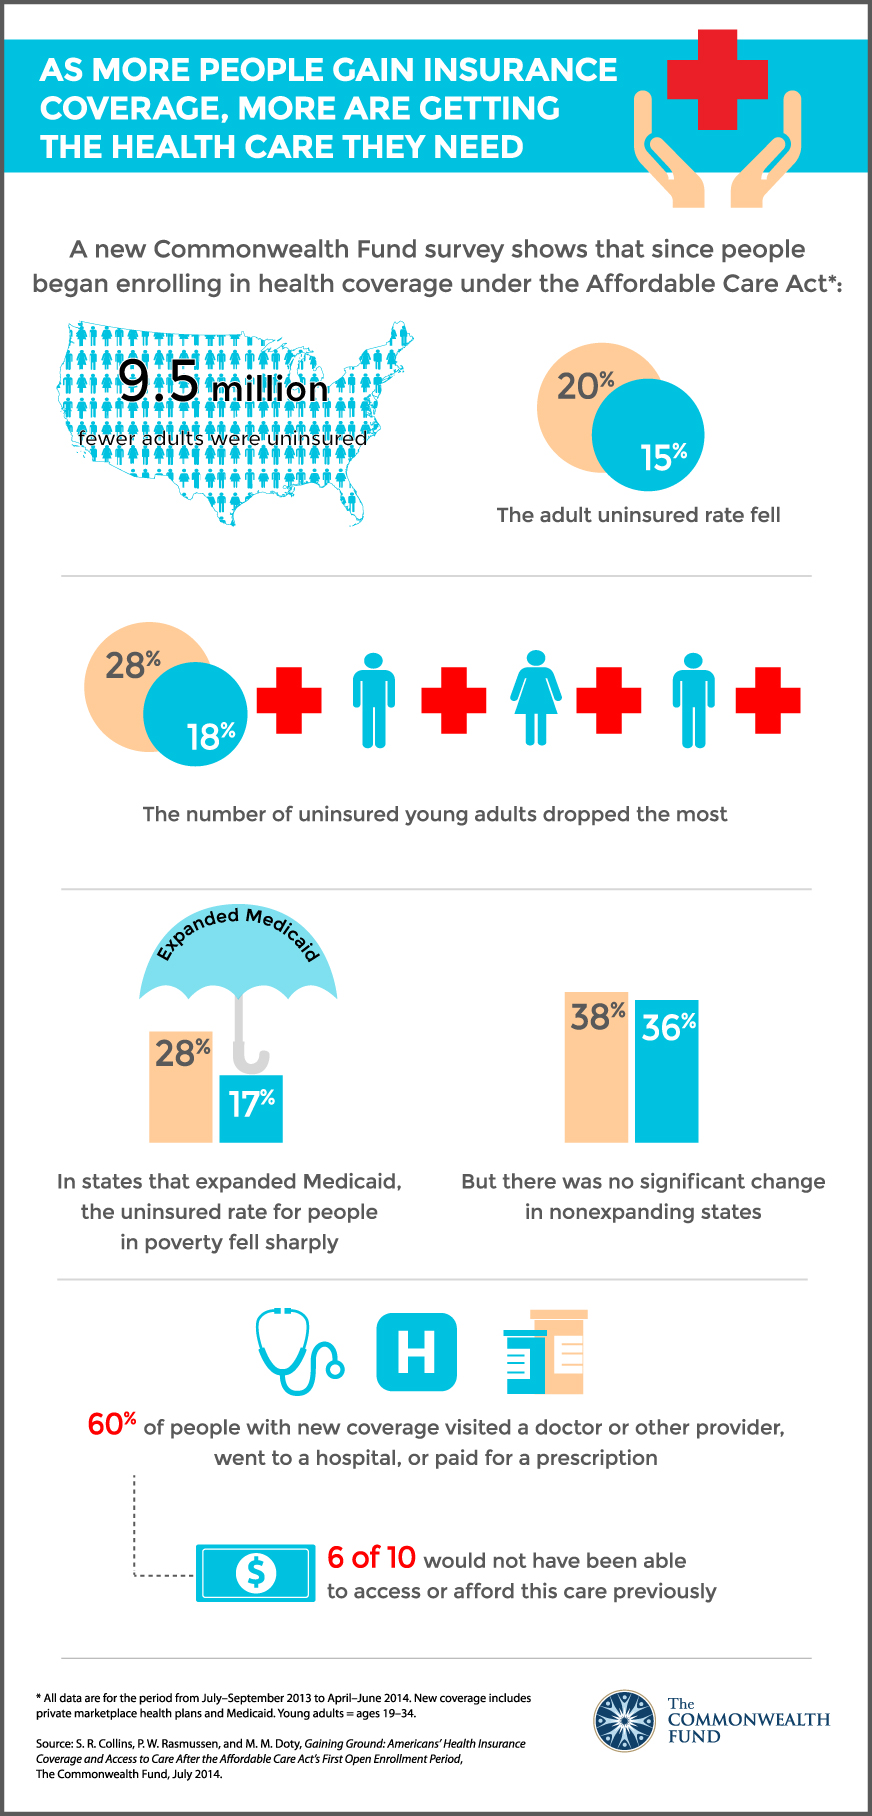
Here are some additional sign-up statistics about the number of uninsured from a July study by the Commonwealth Fund. This data looks only at open enrollment (unlike our total numbers which take into account all ACA-related sign-ups since it was signed into law). Notice that their data for the uninsured rate is, both before and after the ACA, a few points higher than the data in the April Gallup study.
• The uninsured rate for people ages 19 to 64 declined from 20 percent in the July-to-September 2013 period to 15 percent in the April-to-June 2014 period.
• An estimated 9.5 million fewer adults were uninsured during the above period. Young men and women drove a large part of the decline: the uninsured rate for 19-to-34-year-olds declined from 28 percent to 18 percent, with an estimated 5.7 million fewer young adults uninsured.
• By June, 60 percent of adults with new coverage through the marketplaces or Medicaid reported that they had visited a doctor or hospital or filled a prescription; of these, 62 percent said they could not have accessed or afforded this care previously.
Other Enrollment Statistic Estimates
Other enrollment number estimates have come out from different sources. If you are interested in getting a different take, look at Kathleen Sebelius’s claim that 22 million got ‘affordable coverage’ or see enrollment breakdowns at ACAsignups.net. Both of these estimates use the same data and draw similar conclusions – that enrollments were in the 15 million to 22 million range.
Could All These Estimates’ Statistics Be High?
Opponents of the law claim a wide variety of numbers for enrollments. First, you have to remember that, when we say enrollments under the ACA, we mean all insurance types – not just the 8 million through the marketplace. If you take the 4.7 million who lost their plans, subtract that from the 8 million who got plans on the marketplace, and then subtract those who may not pay, you get a number more like 4 million. Of course, the 4.7 million who lost plans got insurance through more places than just the marketplace. When taking all the data into account, the real numbers truly seem to be closer to our 15 million estimate which, as you can read below, is pretty conservative.
Consider for 2015: HHS’s 2015 estimate of newly insured, those who have coverage who wouldn’t have before the ACA, was 16.4 million. There are 320 million citizens in the US, meaning 1% of the population equals 3.2 million. According to Gallup the uninsured rate dropped by 5% since 2013. So 5.2 x 3.2 = 16.64 million. It seems as though HHS and Gallup are both drawing similar conclusions. If we do the math for the low 14.4% ACA uninsured rate, we get about 8 million who have coverage as of March 2015 but wouldn’t have had it before. 2.5 x 3.2 = 8 million. So is the real number 16.4 million or 8 million, the exact number isn’t something we can know for sure, but it is clear that the ACA is making a pretty big dent in the uninsured rate.
Enrollment Numbers Vs. Canceled Plans
It was estimated that, in 2014, 4.7 million people (of the approximately 270 or so million people with health insurance in the US) had plans that would be canceled due to the ACA. It’s important to note that this number is not exact and is an average that omits a number of factors which we will cover in depth shortly.
Of those 4.7 million, many were able to stay on their plans due to a fix from the White House which lets Americans keep non-compliant plans until 2017. Some states and insurers didn’t comply, and a number were left with no other option but to switch to a new plan. Others switched because they were offered better plans for less money. Final estimates of the total reduction of uninsured obviously include those who lost their plan.
Please note that almost all of those who lost their plan were able to switch to another type of coverage. In some cases, this meant better coverage for less money, and in some cases, this meant either paying more or getting lesser coverage. Note that all plans that were canceled were canceled because they failed to offer all the benefits required by the new law.
This group who lost their plans includes about 1.4 million who qualified for free coverage from Medicaid and about 2.35 million who qualified for subsidies. All Americans who had canceled plans qualified for a hardship exemption, meaning that, if they chose not to sign up, they wouldn’t pay the fee for not having insurance in 2014.
Please see the discussion on canceled plans for more detail.
ObamaCare Enrollment Numbers and Sign-Ups In-Depth
Now that we have given you the currently semi-unannotated ObamaCare enrollment number overview above, we can dig into some of the complexities. Let’s take a more in-depth look at the sign-up and enrollment data under the Affordable Care Act done by our resident enrollment number expert Paul Mullen.
Over 15 Million More Americans Have Health Insurance Due to The Affordable Care Act
Both proponents and critics of ObamaCare have been very vocal. One thing they agree on, however, are its aims: Here opponent John Ammon MD states them as he sees them:
ObamaCare was advertised to the American people as a fix for two problems: Reining in the runaway cost of health care and extending health insurance to the uninsured. Long before the law was passed, physicians agreed that major reform of health care financing, taxation, and insurance could help fix these issues, which were very real. The cost of health care had ballooned from coast to coast. These steady increases simultaneously made it harder for many to afford health care or health insurance for their families, thereby driving up the number of uninsured.(1)
Ammon continued: “Intentions didn’t equal results with ObamaCare. Neither of these two problems has been addressed by the law. Health care experts at Harvard University and Dartmouth College still estimate that health care costs will continue to grow faster than the economy for at least the next 20 years. Most troublesome, the federal government estimates that 31 million Americans will still be uninsured by 2024.”
This article is about the effect ObamaCare has had on the uninsured up to April 2014. Based on the experience of health care expansion in Massachusetts, it will take at least three years to see the full effect. Without controlling the ever-rising cost of healthcare, no system can keep people insured. America relies mainly on employer-based insurance, and this has been decreasing each year since 2001. Medicare is the major source of insurance for those over 65, and this too has come under severe pressure from both the rising number of people over 65 and rising costs, particularly for the increased numbers of very elderly. But costs are a topic for another day.
On the numbers insured, we have all heard the news that 8 million people enrolled through state and federal health exchanges. But how many of those will pay? How many lost insurance when their previous, inadequate policies were canceled? You may have heard some politicians claim that cancellations and non-payments outweigh exchange enrollments: claims which earned them “Four Pinnochios” from the Washington Post FactChecker (2). On the other hand, some politicians have made exaggerated claims of the success of the Affordable Care Act.
At ObamaCareFacts.com we aim to give you unbiased facts about ObamaCare, as accurately as possible. So we have been asking what effect has the Affordable Care Act (aka ObamaCare) had in reducing the number of uninsured people in America. To find out, we looked at all available information from many different sources. We looked at how many paid, how many were able to buy new policies off the exchange, how many kept old non-compliant policies, how many are newly covered by Medicaid, and how many have gained or lost employer coverage so far.
The analysis is complicated by the fragmented nature of health insurance in America. Apart from the over 65 population served by Medicare, the rules for health insurance were (and to some extent still are) different in each of the 50 States (+DC). So we have a fragmented collection of different employer-provided insurance policies, individual health plans (which varied widely in quality and may provide only limited benefits) and government-assisted programs, including Medicaid (which is different in every state), VA, Indian Health Service, and many state-run programs.
Data on many of these numbers is not as easily available as exchange enrollment. Some data overlap other data. For example, the elderly may be covered by both Medicare and a retirement plan provided by their former employer. We have used information from a variety of sources and cross-checked it against other sources. While many of the numbers are necessarily best estimates (and thus could turn out to be a little smaller or larger), we have compared different sources and found they point to the same overall results.
Our best estimate is that, as a result of ObamaCare, over 15 million people who otherwise would have been uninsured now have health insurance.
ObamaCare Enrollment: Evidence From Gallup Surveys
With so much uncertainty about who already had insurance as well as with the constant “churn” between employer, individual, Medicaid, and being uninsured as people’s life circumstances change, it is very difficult to look at one set of numbers in isolation. A much better way to estimate the overall effect of the ACA on the uninsured is by surveying a representative sample of the population. While the Census Bureau gathers health insurance through two very large annual surveys – The Community Population Survey and the American Community Survey – the results from these big surveys will not be ready for a long time. Nor will the CDC’s National health Interview Survey, the quarterly results of which are published about 6 months after the end of each quarter.
In the mean time, the best data comes from the Gallup-HealthWise survey, which interviews 500 people a day (almost 180,000 people each year). We have undertaken our own analysis of this data and compared its results both with those from several other polls and with available data from exchanges and insurance companies.
Let’s start by looking at how the results of the Gallup Poll compared to exchange enrollment:
| Period |
2013-Q3 |
2013-Q4 |
Jan |
Feb |
March |
April |
| Mean Poll Date |
8/14/13 |
11/13/13 |
1/15/14 |
2/14/14 |
3/15/14 |
4/15/14 |
| Exchange Enrolled |
0 |
1.08 |
2.73 |
3.77 |
5.10 |
8.01 |
| % Adults Uninsured |
18.0% |
17.1% |
16.2% |
15.6% |
15.0% |
13.40% |
| Decrease Uninsured |
0.9% |
1.8% |
2.4% |
3.0% |
4.6% |
Note that any sample survey will have three kinds of error in its estimates. The first comes from the size of the sample, and with almost 15,000 interviews a month, Gallup is far larger than most. Nevertheless, some sampling variation will result. For example, they announced at a press conference in mid-April that the uninsured rate had fallen to 12.9% based on just half a month’s results. That looked rather low at the time, and when the complete month was analyzed, April’s result turned out to be 13.4%. To minimize sampling error, Gallup prefer to work with quarterly averages, so we will have to wait until early July to see the final value for this quarter. Still, previous monthly averages have turned out to be remarkably consistent, so I doubt if the next two months will bring any major surprises.
The second kind of error is sampling bias. For example, if you just randomly dial phone numbers, you will have a much greater chance of finding someone who has both a home telephone and a cell phone than you will have of finding someone with only one phone. Then some self-employed people like to have separate cell and landline numbers for personal and business calls. The researchers at Gallup are some of the most adept in the industry at removing as much of this variation as possible. However, even they can’t do anything about the small number of people who have no phone at all! By carefully controlling the sample compared to known numbers of people in different categories, they can eliminate a lot of this bias.
Third, whenever you ask a question, you have to be very careful in how you phrase it and, even then, you are likely to get the answer to the question the interviewee thought you were going to ask rather than the question asked. It is well known that almost every health insurance survey understates the number of people covered by Medicaid. Even here, when I compared the number of people reporting they were insured with the exchange enrollment and then with estimates of the number of those policies that had started, it was clear that people reported themselves as insured when they had enrolled for a policy that would not start until the next month (or even the month after). This is likely why the reported uninsured in Q4 of 2013 had dropped compared to the previous quarter even though none of the new Exchange plans started until January 1st. Another possible explanation is that some had already enrolled in Medicaid through the various State exchanges. Also, in October and November of 2013, there was a surge in last-minute enrollments for older pre-Obamacare insurance plans which offered fewer benefits but were cheaper. While state rules differed, in many states, these plans could be sold up until November 30th, 2013.
The decline in the uninsured is not solely due to plans sold on the exchange; expanded Medicaid and CHIP enrollments were a large part of it, (3) and many new individual plans were sold directly by the insurer or through brokers (off the exchanges) (4). The threat of individual mandate penalties may also have increased enrollment in employer plans (5). However, when we compare the decline in the uninsured with exchange enrollments, we find a remarkable correlation suggesting that the wave of interest in signing up for insurance also drove these alternatives.
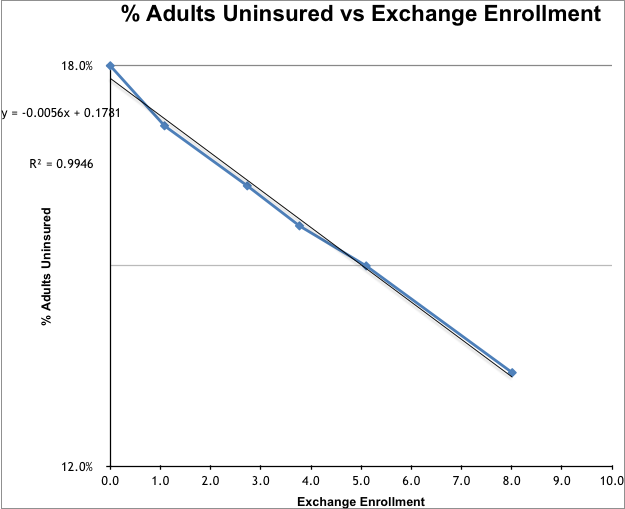
Since the opening of the exchanges, Gallup has seen the percentage of all adults (18+) without health insurance fall from 18.0% (in Q3 2013) to 13.4% April. Given the last-minute enrollments, continuing special enrollments, and continuing Medicaid enrollment all year, it is likely to drop further still.
So, we have a 4.6% drop in uninsured adults (18+). Since there are approximately 240 million adults in the USA, this represents 11 million adults. To this, we must add about 1.5 million children (including exchange plans, off-exchange plans, and Medicaid+CHIPS). This brings us to a 12.5 million decrease in reported uninsured since Q3 of 2013.
In addition, some groups gained coverage through the ACA even before open enrollment. In a separate analysis of data from both Gallup and the National Health Interview Survey, I found that around 2.6 million uninsured young people under 26 gained insurance through their parents’ plans (6). Then, the CMS Medicaid and CHIPS report for March 2014 (7) reports that 949,821 individuals in California, Colorado, Connecticut, District of Columbia, Minnesota, New Jersey, and Washington had enrolled for expanded Medicaid before the start of Open Enrollment under “Early Option” programs.
Of course, there are going to be some who enrolled on the exchange and ended up not paying. The statistics on this have been greatly distorted by the inclusion of people whose payments were not even due. For example, the House Committee on Energy and Commerce estimated that, in Federal exchange states, 67% of those enrolled had not paid by April 15th. However, those states had a particularly great last-minute surge in enrollment, so 41% of those enrollees did not have a payment due until April 30th or later. Most would not even have received their first premium notice by then. Even if we assume that 25% of these late enrollees had paid more than two weeks before they were due to pay, at least 95% of the earlier enrollees must have paid on time!
In general, the assumption that at least 90% will pay seems to be a reasonable estimate and has been confirmed by many major insurance companies, such as Wellpoint. So, let’s knock off 0.8 million for non-payment.
So in total we have:
11 million adults
+1.5 million children
-0.8 million exchange non-paid
+2.6 million under 26
+0.95 million early expansion
Total= 15.25 million gained insurance due to the ACA as of April 2014.
ObamaCare Enrollment Number Resources:
We suggest checking official releases from HHS, the CBO, the US census, and popular polls like Gallup for the most current sign-up information (we used all of these sources in our breakdown). Bear in mind that different surveys use different definitions to collect numbers of uninsured – some express it as a percentage of the whole US population, others adults (18+), and still others only look at adults 18-64 (since almost all those over 65 are covered by Medicare). Another great resource is acasignsups.net, which provides pretty detailed and unbiased looks at sign-up numbers as well.
1. John Ammon MD – ObamaCare versus the Hippocratic Oath. Washington Times May 16, 2014
2. Washington Post FactChecker – The Bogus Claim that the Number of Uninsured Has Increased April 25th, 2014
3. Paul Mullen – New Enrollment in Medicaid and CHIP
4. Paul Mullen – The Numbers covered by other Individual Plans
5. Paul Mullen –Changes in Number of People Covered by Employer Group Coverage
6. Paul Mullen – Number of Uninsured Young Adults added to Parents’ Plans
7. CMS Medicaid & CHIP March 2014 Monthly Applications, Eligibility Determinations, and Enrollment Report. May 1st, 2014
Exploring Enrollment Numbers Under the ACA
Above, you have both a quick and detailed breakdown of general enrollment numbers under the Affordable Care Act. Please continue to explore this section for more detail on topics such as enrollment in Medicaid, Marketplace enrollments, employer enrollments, and enrollments outside of the health insurance marketplace. We will continue to update this section as new sign-up and enrollment data is released.
Understanding ACA Signups and Enrollment Numbers
![]()
Author: Thomas DeMichele
Thomas DeMichele is the head writer and founder of ObamaCareFacts.com, FactsOnMedicare.com, and other websites. He has been in the health insurance and healthcare information field since 2012. ObamaCareFacts.com is a...
Thomas DeMichele's Full Bio