Uninsured Rate Below 10% Under ObamaCare


A new 2015 CDC study shows the uninsured rate below 10% at 9.2% for the first 3 months of 2015. Let’s take a look at what these numbers mean and how the Affordable Care Act impacted the uninsured rate.
Summary of the CDC Study on Uninsured under ObamaCare
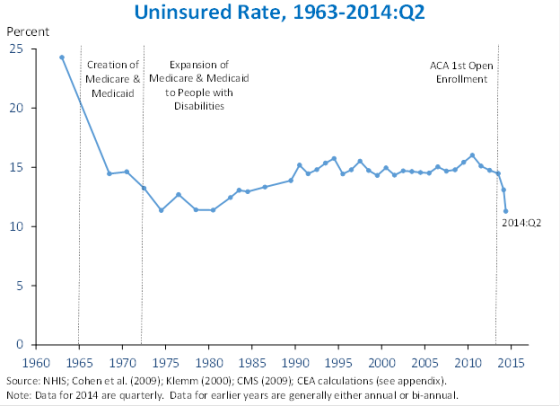
From January through March 2015, the percentage of persons uninsured (including children and seniors) at the time of interview was 9.2% (29.0 million), a decrease of 2.3 percentage points from the 2014 uninsured rate of 11.5% (36.0 million).
Key Findings From the Report
- In the first 3 months of 2015, 29 million persons of all ages (9.2%) were uninsured at the time of interview, 7 million fewer persons than in 2014.
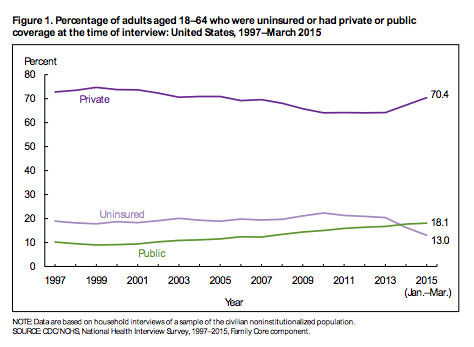
- Among adults aged 18–64, the percentage uninsured decreased from 16.3% in 2014 to 13.0% in the first 3 months of 2015. There was a corresponding increase in private coverage, from 67.3% to 70.4%.
- Among children under age 18 years, the percentage with private coverage increased from 52.6% in 2013 to 56.3% in the first 3 months of 2015, reversing a 14-year trend of declining rates of private coverage.
- Among those under age 65, the percentage with private coverage through the Health Insurance Marketplace or state-based exchanges increased from 2.5% (6.7 million) in the last 3 months of 2014 to 3.6% (9.7 million)
You can get more information on how all the enrollment numbers work together here or learn more about the uninsured here.
Understanding the Data on the Uninsured Rate of 9.2% Versus 11.5% Versus 13.0% for 2015
The data is from The National Health Interview Survey (NHIS) done by the Centers for Disease Control and Prevention’s (CDC) National Center for Health Statistics (NCHS). This study is based on data from the U.S. Census Bureau and it is updated quarterly. This particular study was based on 26,121 interviews.
The CDC study shows an uninsured rate of 13.0% for adults 18 -64 and 9.2% for persons of all ages (including children and seniors). Both of these numbers represent a significant drop from 2014 when compared to it’s own study.
This study is different than other studies done on the uninsured. For example another highly respected survey by Gallup shows the uninsured rate among U.S. adults aged 18 to 64 was 11.4% in the second quarter of 2015, down from 11.9% in the first quarter. This study is based on approximately 44,000 interviews.
Both of these findings are based on survey data as well as actual available enrollment data. Every percentage point accounts for about 3.2 million people, so the discrepancy between 9.2% – 11.4% – 13% is significant, the numbers that should be being compared here are the CDC’s 13.0% and Gallup’s 11.4%.
If you want to get more detailed you’ll want to read the technical notes on page 8 of the study.
How Does the Affordable Care Act Affect the Uninsured Rate?
The Affordable Care Act expanded coverage options through Medicaid, the Marketplace, and Employers. These have been the primary causes of a drop in the uninsured rate in the 18 -64 demographic. In Medicaid and the Marketplace the biggest reduction in uninsured has been with those with low incomes and with non-whites, but arguably the biggest cause for the drop in uninsured (at least according to a separate but interesting RAND corporation study) is the “employer mandate” (the requirement for large employers to cover their workers).
A May 2015 RAND corporation study estimated that 22.8 million got coverage and 5.9 million lost plans for a net total of 16.9 million newly insured. 9.6 million people enrolled in employer-sponsored health plans, followed by Medicaid (6.5 million), the individual marketplaces (4.1 million), non-marketplace individual plans (1.2 million) and other insurance sources (1.5 million).
Author: Thomas DeMichele
Thomas DeMichele is the head writer and founder of ObamaCareFacts.com, FactsOnMedicare.com, and other websites. He has been in the health insurance and healthcare information field since 2012. ObamaCareFacts.com is a...
Thomas DeMichele's Full Bio