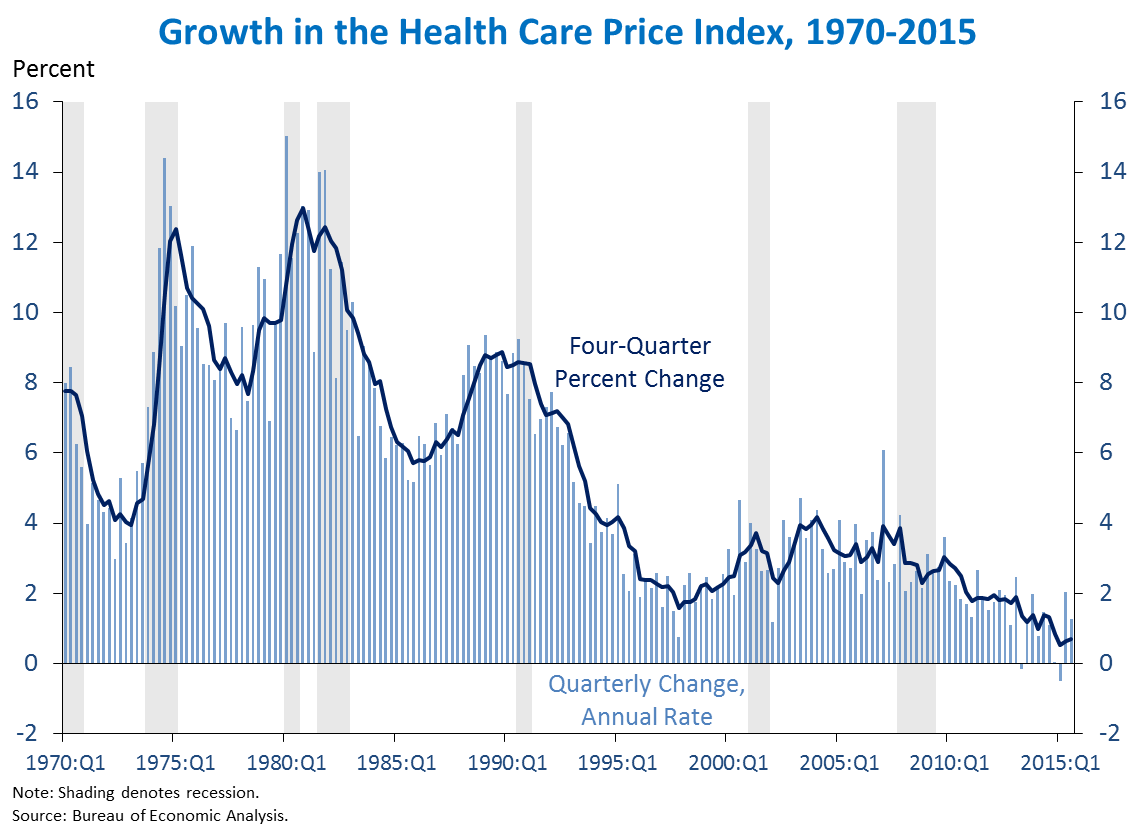
Cost Curbing is Working, HealthCare Spending Slowest Rate Since 60’s


Healthcare spending under the ACA has grown at the slowest rate on record since the early 60’s in 2014 and 2015, hinting that ObamaCare’s cost curbing is working. This information is confirmed by a recent December 22nd report by Whitehouse.gov.
The slow increase translates to lower healthcare spending. Coverage provisions aside, one of the main points of the ACA was to reduce long term healthcare spending so it’s good to see confirmation that it’s working. Without decreasing healthcare spending over the long term we risk an increase to the debt and deficit.
The excerpt below is from Whitehouse.gov Third Estimate of Gross Domestic Product for the Third Quarter of 2015.
Prices of health care services have risen just 0.7 percent over the past four quarters, extending the recent period of exceptionally slow health care price inflation, while expanding coverage has driven faster growth in aggregate utilization of health care services. Prior to 2015, an increase in health care services prices as low as the 0.7 percent increase over the most recent four quarters had not been seen since 1961. Continuing an unusual pattern in recent years, the increase in the prices of health care services over the last year was only slightly above the overall increase in consumer prices. From 1960:Q1 through 2010:Q1, the inflation rate for health care services exceeded the inflation rate for all consumer goods and services by an average of 2.1 percentage points.
The continued slow increase in health care prices is a major reason that overall per-enrollee health care spending—the metric of health costs most relevant to individuals and families—continues to grow exceptionally slowly in both the public and private sectors. However, aggregate health care spending—reflecting aggregate utilization of health care services—has grown at an elevated rate in recent quarters. The 4.6 percent increase over the most recent four quarters remains well above the 1.9 percent average rate from 2010 to 2013. This recent acceleration appears to largely reflect increased access to care by the millions of people who have gained health insurance coverage under the Affordable Care Act since the end of 2013. Upward pressure on aggregate utilization growth from expanding coverage is neither a surprise nor a cause for concern and will be temporary, lasting only until coverage stabilizes at its new, higher level in the coming years.

