ObamaCare White House Report December 2016


Is ObamaCare Working?
The White House just released a 100-page report on ObamaCare (the Affordable Care Act). Below are some key facts and the full report.
By most measures, according to the report, ObamaCare is working.
In other words, in many respects, the Patient Protection and Affordable Care Act is living up to its name by ensuring affordable care via perks like tax credits, ensuring expanded access to coverage via improvements to programs like Medicaid, and ensuring key patient protections like the protections from preexisting condition-based exclusions.
This isn’t to say ObamaCare is perfect, it is simply to say there is a lot that is working, and that is what the report covers and what we highlight below.
READ: More technically, on December 13th, 2016 the Council of Economic Advisers released THE ECONOMIC RECORD OF THE OBAMA ADMINISTRATION: REFORMING THE HEALTH CARE SYSTEM (the full report in PDF form), an accompanying chart book, and a summary. Below we present some highlights from the report and the summary. Also, vitally, we are archiving this for future use so people can find it when they search for things like “100-page White House Report on ObamaCare that shows it is working” and such. Learn more here In glowing report, White House says Obamacare is saving lives.
TIP: All facts below are citable via the above report and are backed up on our website. Feel free to ask questions or comment below.
Facts That Show ObamaCare is Working
The introduction to the report covers the basics. The report itself covers the detail. Here are some highlights from the introduction to the report.
- In 2008, the year before the Obama Administration began, more than one-in-seven Americans—44 million people—lacked health insurance coverage. Many uninsured individuals were simply unable to afford coverage, while many others were locked out or priced out of the individual health insurance market because they had preexisting health conditions. Their lack of insurance coverage kept them from being able to obtain the care they needed and left them vulnerable to financial catastrophe if they became seriously ill. Meanwhile, even many Americans with health insurance faced significant risks due to significant gaps in their coverage.
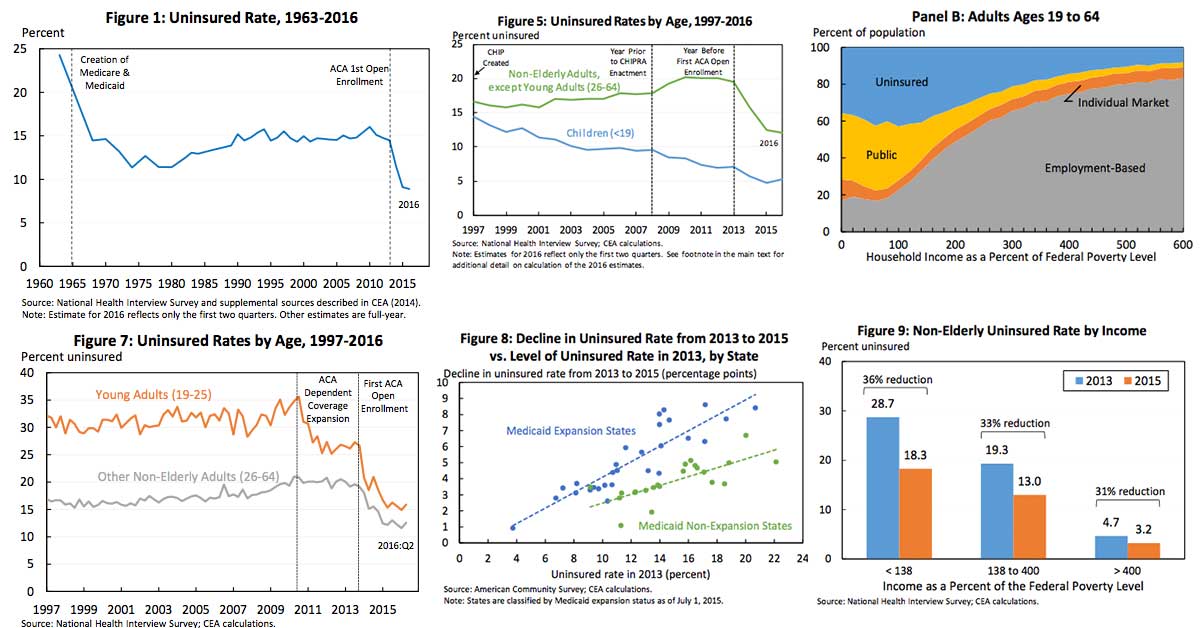
- Because of the coverage provisions of the ACA, an estimated 20 million additional adults now have health insurance. Also, thanks in large part to the ACA and the improvements to CHIP that the President signed into law, the uninsured rate among children has fallen by almost half since the President took office, providing health insurance to more than 3 million additional children. Following these gains, the uninsured rate stands below 9 percent for the first time.
- Nationwide, uncompensated care has fallen by more than a quarter as a share of hospital operating costs from 2013 to 2015, corresponding to a cost reduction of $10.4 billion. Early evidence also suggests that expanded coverage is driving improvements in health that are consistent with we saw in prior research; if experience under the ACA matches what was observed under Massachusetts health reform, we are avoiding an estimated 24,000 deaths annually. Looking beyond the health care sector, the ACA has also sharply reduced medical outcomes due to income inequality, and it has achieved this broad range of benefits without the adverse near-term effects on the labor market that the ACA’s critics predicted, while also helping to lay the foundation for a stronger labor market over the long term.
- Due to the spread of out-of-pocket limits since 2010, an estimated 22 million additional people enrolled in employer-sponsored plans are protected against catastrophic costs in 2016. Similarly, because of the ACA’s provision phasing out the Medicare Part D coverage gap, more than 11 million Medicare beneficiaries have received cumulative savings on prescription drugs averaging more than $2,100 a person as of the middle of 2016.
- ACOs and APMs (accountable care organizations and alternative payment methods) have both shown early signs of success. Using the tools provided by the ACA, the Administration has made considerable progress in deploying APMs, including accountable care, bundled payment, and medical home models. As of early 2016, more than 30 percent of traditional Medicare payments were estimated to be associated with APMs, up from virtually none in 2010. The tools provided by the ACA, which were enhanced by the bipartisan physician payment reform legislation enacted in 2015, will drive further progress in the years ahead.
- The six years since the ACA became law have seen very encouraging trends in both health care costs and health care quality. Prices of health care goods and services have grown at a slower rate under the ACA than during any period of the same length since these data began in 1959. Recent years have also seen exceptionally slow growth in per-enrollee spending in both public programs and private insurance. In parallel, there have been promising indications that quality of care is improving. The rate at which patients are harmed while seeking hospital care has fallen by 21 percent since 2010, which is estimated to have led to approximately 125,000 avoided deaths cumulatively through 2015. Medicare beneficiaries’ risk of returning to the hospital soon after discharge has also declined substantially, corresponding to an estimated 565,000 avoided readmissions from April 2010 through May 2015.
- The average premium for people who hold employer-based family coverage was nearly $3,600 lower in 2016 than if premium growth since the ACA became law had matched the preceding decade. These are savings families will receive directly in the form of lower premium costs and indirectly in the form of higher wages. Far from offsetting the slowdown in premium growth, growth in out-of-pocket costs has slowed as well, and accounting for out-of- pocket costs increases these savings to $4,400 in 2016.
- The typical Medicare beneficiary enrolled in traditional Medicare will incur around $700 less in premiums and cost sharing in 2016 than if Medicare spending trends had matched those projected in 2009. This figure does not include reductions in cost sharing on prescription drugs due to the combination of the ACA’s provision closing the Medicare Part D coverage gap and slower-than-expected growth in prescription drug spending, so it understates the total savings to Medicare beneficiaries.
- Because State and Federal governments finance a substantial share of health care spending, slower growth in health care costs has also greatly improved the fiscal outlook. Due in large part to the ACA’s provisions slowing the growth of health care costs, CBO projects that the law will reduce deficits by increasing amounts in the years ahead, rising to an average of 1 percent of GDP over the decade starting in 2026. Over the next two decades as a whole, the law is projected to reduce deficits by more than $3 trillion. In addition, since just after the ACA became law, CBO has reduced its projections of Medicare spending under current policies by an additional $125 billion in 2020 or around 0.6 percent of GDP in that year, further improving the fiscal outlook. The combination of the ACA and broader trends in the health care sector have also added 11 years to the life of the Medicare Trust Fund to 2009 projections.
TEN NEW PIECES OF ANALYSIS HIGHLIGHTING PROGRESS IN REFORMING THE HEALTH CARE SYSTEM (Source: The Economic Record of the Obama Administration: Reforming The Health Care System).
1. The uninsured rate has declined in all income groups since 2013, demonstrating that the ACA’s reforms are working in concert to increase insurance coverage. The percentage decline in the uninsured rate since 2013 has been similar in all income groups, showing that the ACA’s reforms have been effective in reaching the uninsured at all income levels. Below 138 percent of the Federal Poverty Level (FPL), coverage gains have been driven primarily by Medicaid expansion. Coverage gains at higher income levels reflect the ACA’s interlocking reforms to the individual health insurance market: banning discrimination based on pre-existing conditions, providing financial assistance to make coverage affordable, and implementing an individual responsibility provision. In particular, the 31 percent decline in the uninsured rate among people with incomes above 400 percent of the FPL, who are not eligible for financial assistance under the law, shows that the combination of the law’s new consumer protections and individual responsibility provision have been effective in increasing coverage.

2. Expanded coverage is improving access to care, health, and financial security for the newly insured.Nationally, the share of Americans reporting that they have forgone medical care due to cost has fallen by a third since 2010, with particularly rapid declines since the ACA’s main coverage provisions took effect in 2014. As shown in the figure below, declines in the share of people forgoing care due to cost were larger in states that saw larger declines in their uninsured rates. The report documents that states seeing larger declines in their uninsured rates have also seen larger increases in the share of people reporting that they have a personal doctor and reporting that they have had a checkup in the last 12 months. The report also reviews early evidence that expanded coverage is translating into improved health and financial security, findings consistent with research examining prior, similarly targeted coverage expansions. Notably, if experience under the ACA matches what was observed under Massachusetts health reform, 24,000 deaths are already being avoided annually because of expanded coverage under the ACA.

3. Expanded coverage is reducing the burden of uncompensated care on the health care system, especially in States that have expanded Medicaid. Using data from hospitals’ annual cost reports, the report documents that uncompensated care has fallen by more than a quarter as a share of total hospital costs from 2013 to 2015. The nationwide decline corresponds to a reduction in hospital uncompensated care costs of $10.4 billion in 2015. Medicaid expansion states have seen a much larger decline in uncompensated care as a share of hospital costs, a drop of around one half. The report reviews recent evidence that these declines are a direct result of the ACA’s coverage provisions, particularly the ACA’s Medicaid expansion.

4. Increases in Health Insurance Marketplace premiums for 2017 are a one-time pricing correction, not a harbinger of future market instability. The report presents detailed evidence that the Marketplace premium increases implemented for 2017 are one-time adjustments to accommodate the phasedown of the ACA’s transitional reinsurance program and correct for initial underpricing, not a reflection of troubling trends in underlying individual market claims costs. Moreover, the report shows that, as illustrated in the figure below, the largest premium increases since 2014 have been seen in areas of the country that had the lowest premiums in 2014, the first year of the new market. This is consistent with the view that the larger premium increases in some areas reflect the fact that insurers in those areas underpriced initially, while insurers in other areas priced appropriately or even overpriced.

5. Not only does the ACA’s design prevent a “death spiral,” but experience to date confirms that the 2017 pricing correction does not threaten market stability. Some analysts have suggested that the premium increases occurring in 2017 could cause large reductions in individual market enrollment, particularly among healthy individuals, threatening the market’s long-term stability. The report demonstrates that these fears are ill-founded. Because about two-thirds of individual market enrollees are eligible for premium tax credits, most enrollees will not be affected by higher premiums, preventing meaningful risk pool deterioration. Consistent with this view, individual market enrollment growth differed little between states seeing larger and smaller increases in the benchmark premium in 2015, and states that saw larger premium increases actually saw slightly smaller increases in claims costs, as depicted by the black lines in the figure. By contrast, for the individual market to be at risk of a death spiral, states seeing larger premium increases would have had to have seen sharply lower enrollment growth and sharply higher growth in claims costs, akin to the scenario depicted by the red lines in the figure.

6. National health expenditures are projected to be $2.6 trillion lower over the ACA’s first decade than expected prior to the ACA, even though millions more Americans now have health insurance. Cumulative national health expenditures over the 2010 through 2019 period are now projected to be $2.6 trillion lower than projected just before the ACA became law. In 2019 alone, national health expenditures are projected to be 13 percent and 1.7 percent of GDP lower than pre-ACA projections. Health care spending is projected to be lower despite expanded coverage because projections of underlying per enrollee health care spending have fallen dramatically.

7. Recent years’ slow growth in per enrollee health care spending has been seen in all major spending categories. CEA has previously noted that per enrollee health care spending has grown exceptionally slowly in both the public and private sectors under the ACA, with real private insurance spending per enrollee growing at less than one-third the rate that it grew over the pre-ACA decade and real Medicare spending per enrollee actually falling in recent years. Today’s report takes a closer look at what specific services have driven this slowdown, finding that slower growth has been seen across all three of the largest spending categories: hospital services, physician services, and prescription drugs.

8. The average premium for job-based family coverage is $3,600 lower in 2016 than if premium growth since 2010 had matched the pre-ACA decade; accounting for trends in out-of-pocket costs increases these savings to $4,400. Premiums for employer coverage have grown much more slowly in recent years than over the decade preceding the ACA, with a particularly large slowdown in the growth of workers’ direct premium contributions. The average total premium for employer-based family coverage is around $3,600 lower in 2016 than if nominal growth since 2010 had matched the pre-ACA decade, savings that accrue to workers in the form of higher wages and lower contributions to their portion of premiums. New estimates in today’s report shows that slower growth in premiums is not being “canceled out” by faster growth in out-of-pocket spending. In fact, growth in total spending—encompassing both premiums and out-of-pocket costs—has fallen by more than growth of premiums alone, as illustrated in the figure. Consistent with this, accounting for trends in out-of-pocket costs during the post-ACA period increases the 2016 savings for a family with employer-based coverage to $4,400.

9. The typical Medicare beneficiary enrolled in traditional Medicare will incur $700 less in premiums and out-of-pocket costs in 2016 due to slower growth in health care costs. Because of recent years’ slow growth in health care costs, per beneficiary Medicare spending is far below earlier projections. The premiums and cost sharing that Medicare beneficiaries pay depend directly on underlying per beneficiary costs, so lower overall Medicare spending leads to large savings for beneficiaries. The typical beneficiary enrolled in traditional Medicare will incur approximately $700 less in premiums and cost sharing in 2016 than if cost trends in Medicare had matched projections issued in 2009. As discussed in the report, this estimate does not incorporate reductions in cost sharing for prescription drugs due to the ACA’s provision closing the Medicare Part D coverage gap and lower-than-expected prescription drug spending. Including those savings would make this estimate even larger.

10. New data show continued improvement in the quality of care in hospitals, which has led to approximately 125,000 avoided deaths from 2010 to 2015. New data released yesterday by the Agency for Healthcare Research and Quality (AHRQ) show that the rate of hospital-acquired conditions, like infections and complications due to medication errors, continued to decline in 2015. The overall rate of hospital-acquired conditions has fallen by 21 percent since 2010, which AHRQ estimates has led to approximately 125,000 avoided deaths through 2015. Today’s CEA report presents evidence that these declines result, at least in part, from value-based purchasing payment reforms introduced under the ACA, as well as an ACA-supported initiative to help hospitals identify and share best practices for avoiding patient harm.

Author: Thomas DeMichele
Thomas DeMichele is the head writer and founder of ObamaCareFacts.com, FactsOnMedicare.com, and other websites. He has been in the health insurance and healthcare information field since 2012. ObamaCareFacts.com is a...
Thomas DeMichele's Full Bio
Margarita Ramirez
So much talk about medicare but what about those who aren’t old enought. Ages between 18 and 55 whose wages don’t qualify for medical but buying insurance that isn’t accepted by any only low income clinics, other than emergencies 911 and then even then they still send you the bill over 1k because Obamacare doesn’t cover the procedures. Doesn’t seem to work.
Linda Unterman
very informative report. I wish I could remember all the statistics so I could counter everyone that wants to ditch Obamacare. Thanks for doing your best, President Obama. When we had private insurance before I went on Medicare, we were paying $75,000 a year for insurance because of my pre-existing condition. But we couldn’t switch insurance because no one else would insure me. I have MS.