ObamaCare Cost Drops to $1,207 Billion Net


The CBO announced ObamaCare’s new cost of $1,207 billion net in it’s March 2015 report which includes Updated Estimates of the Insurance Coverage Provisions of the Affordable Care Act.
- The CBO and JCT estimate a net cost of $1,207 billion over 2016-2025.
- That’s $142 billion (or 11 percent) less than the agencies estimated in January 2015.
- This is, in-part, due to a downward trend in spending by private health insurers on health care and administration. The CBO and JCT estimate that growth in private health insurance spending per enrollee over the 2006–2013 period averaged 1.8% per year, compared with an average rate of 5.0% per year during the 1998–2005 period.
- So far (almost) every CBO report has dropped the price-tag of the ACA. This is, again in-part, due to the curbing of healthcare costs and in-part due to less participation in subsidy programs than originally expected.
The biggest changes in this report are:
- Less people are expected to pay the excise tax. This is means less revenue for the ACA, but is also in-part due to falling health care prices driving down the cost of high-end plans.
- Silver plan costs are expected to rise. Despite all other plans falling, the CBO feels insurers will need to beef up Silver plan networks and benefits and thus raise the price-tag. Silver plans are popular and are the only plans that offer all subsidy types. Narrow networks aren’t going to cut it for the countries most popular plans.
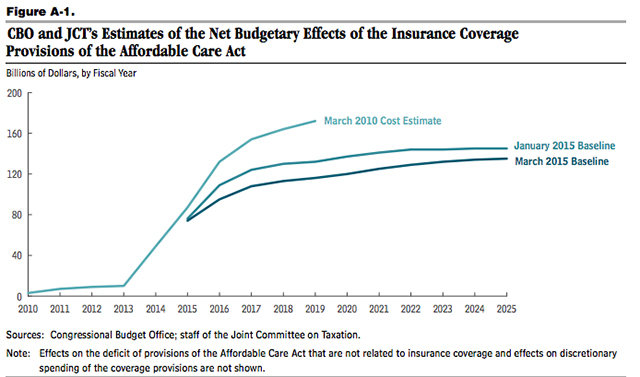
As healthcare cost trends curb downward, subsidy spending and revenue generated from taxes are falling along with it. This, coupled with less people than expected taking advantage of cost assistance, has led to pretty drastic changes in CBO / JCT estimates. The changes from March 2010 to March 2015 are pretty major, as illustrated in the graph and data below.
As we point out on our cost page the CBO only takes into account major coverage provisions and taxes. There is a lot of law that includes spending and many cost curbing measures, so the full picture will always be somewhat unknown (at least as far as projections go). That being said, the CBO and JCT are tasked with the job of estimating the cost of the budgetary effects of legislation on the entire economy, so in that regard they have done impressively well.
Comparing Gross Costs of Passed CBO reports
CBO report April 2014: The gross cost of ObamaCare is $1,839 offset by $456 billion in revenue for 2015–2024, for an estimated net cost of 1.36 Trillion. It is the Congressional Budget Office’s job to point out what must change with spending to keep the deficit and debt in-line. Sot it is expected that we see cost curbing measures and taxes on the table for 2015.
CBO report January 2015: The gross cost of ObamaCare is $1,993 offset by $643 in revenue for 2015–2024, for an estimated net cost of 1.35 Trillion. Note that this is due primarily to less people than projected getting subsidies during open enrollment 2015. CBO predicted 13 million in April, but revised that to 12 million in January. It’s important to understand they mean average enrolled throughout 2015, not those who enroll during open enrollment only (HHS predicts 9.1 million enrolled by February 15th, 2015). You’ll note that an additional $200 billion in revenue is also projected.
CBO report March 2015: In 2015 – 2025 updated budget projections the CBO estimate the gross cost of ObamaCare to be $1,707 offset by $500 in revenue for 2015–2024, for an estimated net cost of 1.207 Trillion. This is, in-part, due to a downward trend in spending by private health insurers on health care and administration. The CBO and JCT estimate that growth in private health insurance spending per enrollee over the 2006–2013 period averaged 1.8% per year, compared with an average rate of 5.0% per year during the 1998–2005 period.
Key Excerpts from the March 2015 Report
Below are some key excerpts from the report itself.
CBO and JCT now project that the government’s net costs for exchange subsidies and related spending and revenues over the 2016–2025 period will be $849 billion— $209 billion (or 20 percent) below the previous projection. That reduction is largely a result of projections of slower growth in premiums and, to a lesser extent, slightly lower exchange enrollment.
CBO and JCT now project that the federal cost of the additional enrollment in Medicaid and CHIP under the ACA over the 2016–2025 period will be $847 billion, $73 billion (or 8 percent) less than they projected in January 2015. That change is mostly the result of a downward revision to the estimated number of people gaining Medicaid coverage because of the ACA (as discussed above). CBO and JCT now anticipate that, in most years, about 2 million fewer people will enroll in Medicaid or CHIP because of the ACA than they projected previously.
The $144 billion reduction in projected savings from the ACA’s insurance coverage provisions is mainly attributable to revisions to projected federal revenues stemming from the excise tax on certain high-premium insurance plans and to other effects on revenues and outlays arising from projected changes in employment-based coverage.
CBO and JCT now estimate that federal revenues stemming from the excise tax on certain high-premium insurance plans will be $62 billion (or 41 percent) lower over the 2016–2025 period than was estimated previously. Because premiums are now projected to be lower, fewer workers are expected to be enrolled in employment-based insurance plans whose costs exceed the excise tax thresholds specified in the ACA.
In addition, CBO and JCT now estimate that the ACA’s insurance coverage provisions will have other effects on revenues and outlays that will lower estimated savings (and thus boost estimated net costs) by $81 billion (or 29 percent) relative to the agencies’ previous projection. That change is mainly attributable to a projection of a smaller amount of additional revenues generated by losses in employment-based coverage: The agencies now project that, on net, 1 million to 2 million fewer people will move out of employment-based coverage under the ACA than they projected previously. A smaller loss of employment-based coverage means that less nontaxable compensation in the form of health benefits will be converted to taxable compensation as a result of the ACA. Moreover, the downward revision to projected premiums for employment-based coverage means that the losses in such coverage as a result of the ACA will yield smaller increases in taxable compensation and therefore smaller increases in tax revenues.
We will do a breakdown of the report shortly. For now, here go to page 15 and read what has changed for yourself.
Author: Thomas DeMichele
Thomas DeMichele is the head writer and founder of ObamaCareFacts.com, FactsOnMedicare.com, and other websites. He has been in the health insurance and healthcare information field since 2012. ObamaCareFacts.com is a...
Thomas DeMichele's Full Bio
Vince Scalco
I am under the impression that the act had provisions in it that insulated insurance companies from losses on the policies sold in the exchange markets for an initial period of time. Is that correct and can you please provide more details.
I am also under the impression that when it became time to cover those losses at some point in time the federal govt did not cover those losses as proscribed. Lack of providing for them in new budgets. Is that correct?